Calculus: Early Transcendentals
8th Edition
ISBN:9781285741550
Author:James Stewart
Publisher:James Stewart
Chapter1: Functions And Models
Section: Chapter Questions
Problem 1RCC: (a) What is a function? What are its domain and range? (b) What is the graph of a function? (c) How...
Related questions
Question

Transcribed Image Text:### Image Transcription for Educational Website
#### Graph Descriptions:
**Graph b:**
- The graph displays a coordinate plane with x-axis ranging from -6 to 6 and y-axis also ranging from -6 to 6.
- Both axes are marked with increments of 1 unit.
- The graph is empty, showing no plotted function or points.
**Graph c:**
- Similar to Graph b, this graph displays a coordinate plane with x and y-axes ranging from -6 to 6.
- Both axes are marked with increments of 1 unit.
- The graph is empty, with no plotted function or points.
**Graph d:**
- This graph shows a coordinate plane where the x and y axes range from -6 to 6.
- It features a curve with two distinct branches:
- The first branch is in the first quadrant, starting from near the origin and sharply increasing as it approaches x=0 from the positive side, indicating the presence of a vertical asymptote.
- The second branch is in the third quadrant, starting from close to x=0 on the negative side and decreasing further as it moves toward the negative y-values.
- This graph likely represents a rational function with a vertical asymptote at x=0 and horizontal asymptotes as x approaches positive and negative infinity.
These graphs are examples for students learning to identify and analyze various types of functions and their characteristics.
![The graph of a function \( f \) is shown below.
*Graph Description:*
A straight line graph is plotted on a coordinate grid ranging from -6 to 6 on both the x and y axis. The line has a negative slope, passing through the points (-5, 5) and (5, -5).
**Task:**
Sketch the graph of the derivative \( f' \).
_Select one:_
a. [Graph with Curve]
- This option shows a curve in a coordinate grid. The curve starts at approximately (0, 3), curves downward passing close to (1, 0), and continues decreasing.
**Note:** Option 'a' is marked as incorrect.
b. [Second Graph Placeholder]
- (Image not provided for option b; therefore, no description is available.)](/v2/_next/image?url=https%3A%2F%2Fcontent.bartleby.com%2Fqna-images%2Fquestion%2Fa89fcfbc-9661-4037-a401-8de41697cbc3%2F3f45d33f-e956-4914-9707-f16b3cf3269d%2Fgkpq6op_processed.jpeg&w=3840&q=75)
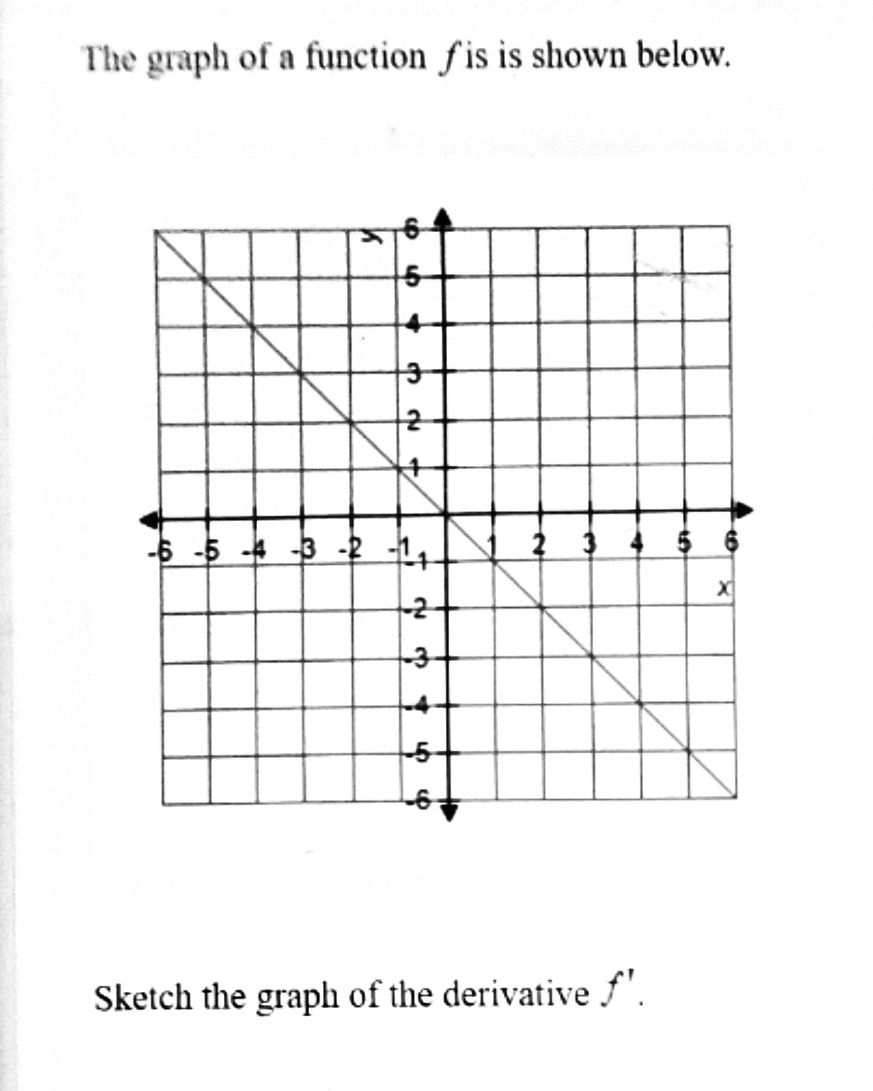
Transcribed Image Text:The graph of a function \( f \) is shown below.
*Graph Description:*
A straight line graph is plotted on a coordinate grid ranging from -6 to 6 on both the x and y axis. The line has a negative slope, passing through the points (-5, 5) and (5, -5).
**Task:**
Sketch the graph of the derivative \( f' \).
_Select one:_
a. [Graph with Curve]
- This option shows a curve in a coordinate grid. The curve starts at approximately (0, 3), curves downward passing close to (1, 0), and continues decreasing.
**Note:** Option 'a' is marked as incorrect.
b. [Second Graph Placeholder]
- (Image not provided for option b; therefore, no description is available.)
Expert Solution
Step 1: Given problem

Trending now
This is a popular solution!
Step by step
Solved in 3 steps with 1 images

Recommended textbooks for you

Calculus: Early Transcendentals
Calculus
ISBN:
9781285741550
Author:
James Stewart
Publisher:
Cengage Learning

Thomas' Calculus (14th Edition)
Calculus
ISBN:
9780134438986
Author:
Joel R. Hass, Christopher E. Heil, Maurice D. Weir
Publisher:
PEARSON

Calculus: Early Transcendentals (3rd Edition)
Calculus
ISBN:
9780134763644
Author:
William L. Briggs, Lyle Cochran, Bernard Gillett, Eric Schulz
Publisher:
PEARSON

Calculus: Early Transcendentals
Calculus
ISBN:
9781285741550
Author:
James Stewart
Publisher:
Cengage Learning

Thomas' Calculus (14th Edition)
Calculus
ISBN:
9780134438986
Author:
Joel R. Hass, Christopher E. Heil, Maurice D. Weir
Publisher:
PEARSON

Calculus: Early Transcendentals (3rd Edition)
Calculus
ISBN:
9780134763644
Author:
William L. Briggs, Lyle Cochran, Bernard Gillett, Eric Schulz
Publisher:
PEARSON

Calculus: Early Transcendentals
Calculus
ISBN:
9781319050740
Author:
Jon Rogawski, Colin Adams, Robert Franzosa
Publisher:
W. H. Freeman


Calculus: Early Transcendental Functions
Calculus
ISBN:
9781337552516
Author:
Ron Larson, Bruce H. Edwards
Publisher:
Cengage Learning