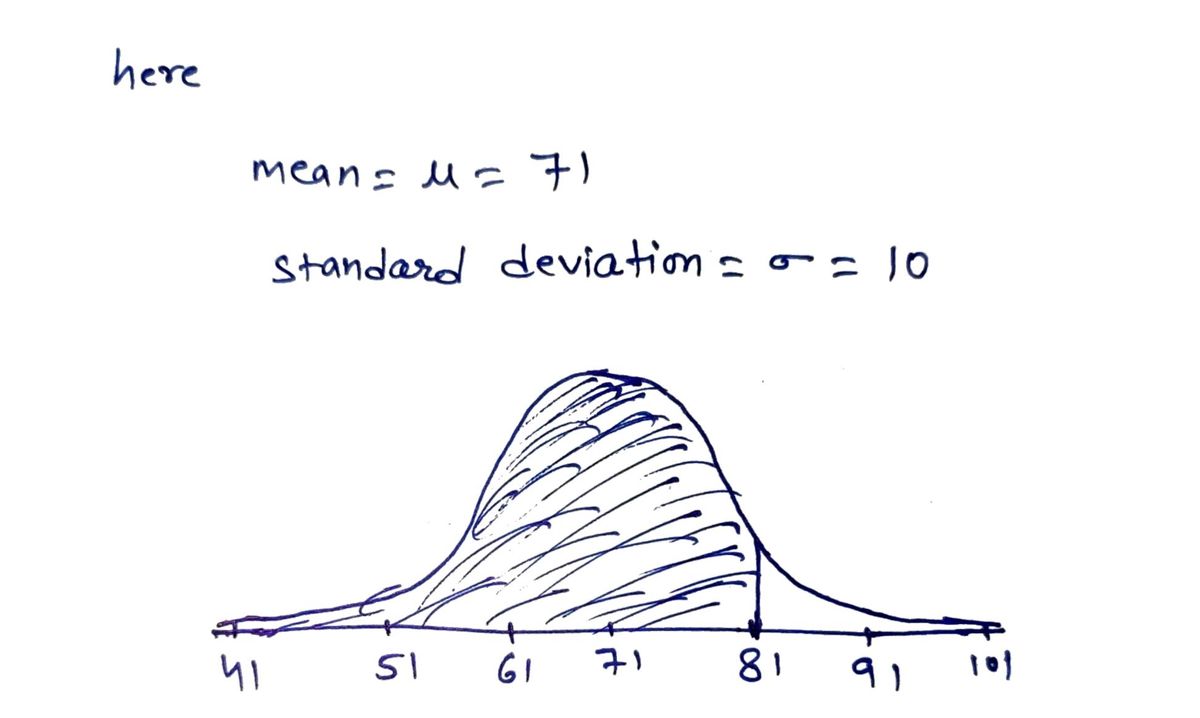
The graph illustrates the distribution of test scores taken by College Algebra students. The maximum possible score on the test was 120, while the mean score was 71 and the standard deviation was 10. 41 51 61 71 81 91 101 Distribution of Test Scores Use the "Empirical Rule", not a calculator or other technology. What is the approximate percentage of students who scored lower than 81 on the test?
The graph illustrates the distribution of test scores taken by College Algebra students. The maximum possible score on the test was 120, while the mean score was 71 and the standard deviation was 10. 41 51 61 71 81 91 101 Distribution of Test Scores Use the "Empirical Rule", not a calculator or other technology. What is the approximate percentage of students who scored lower than 81 on the test?

MATLAB: An Introduction with Applications
6th Edition
ISBN:9781119256830
Author:Amos Gilat
Publisher:Amos Gilat
Chapter1: Starting With Matlab
Section: Chapter Questions
Problem 1P

Related questions
Question
The graph illustrates the distribution of test scores taken by College Algebra students. The maximum possible score on the test was 120, while the mean score was 71 and the standard deviation was 10.

Transcribed Image Text:The graph illustrates the distribution of test scores taken by College Algebra students. The maximum
possible score on the test was 120, while the mean score was 71 and the standard deviation was 10.
41
51
61
71
81
91
101
Distribution of Test Scores
Use the "Empirical Rule", not a calculator or other technology.
What is the approximate percentage of students who scored lower than 81 on the test?
Expert Solution
Step 1

Step by step
Solved in 2 steps with 2 images

Recommended textbooks for you
MATLAB: An Introduction with Applications
Statistics
ISBN:
9781119256830
Author:
Amos Gilat
Publisher:
John Wiley & Sons Inc

Probability and Statistics for Engineering and th…
Statistics
ISBN:
9781305251809
Author:
Jay L. Devore
Publisher:
Cengage Learning

Statistics for The Behavioral Sciences (MindTap C…
Statistics
ISBN:
9781305504912
Author:
Frederick J Gravetter, Larry B. Wallnau
Publisher:
Cengage Learning
MATLAB: An Introduction with Applications
Statistics
ISBN:
9781119256830
Author:
Amos Gilat
Publisher:
John Wiley & Sons Inc
Probability and Statistics for Engineering and th…
Statistics
ISBN:
9781305251809
Author:
Jay L. Devore
Publisher:
Cengage Learning
Statistics for The Behavioral Sciences (MindTap C…
Statistics
ISBN:
9781305504912
Author:
Frederick J Gravetter, Larry B. Wallnau
Publisher:
Cengage Learning

Elementary Statistics: Picturing the World (7th E…
Statistics
ISBN:
9780134683416
Author:
Ron Larson, Betsy Farber
Publisher:
PEARSON

The Basic Practice of Statistics
Statistics
ISBN:
9781319042578
Author:
David S. Moore, William I. Notz, Michael A. Fligner
Publisher:
W. H. Freeman

Introduction to the Practice of Statistics
Statistics
ISBN:
9781319013387
Author:
David S. Moore, George P. McCabe, Bruce A. Craig
Publisher:
W. H. Freeman