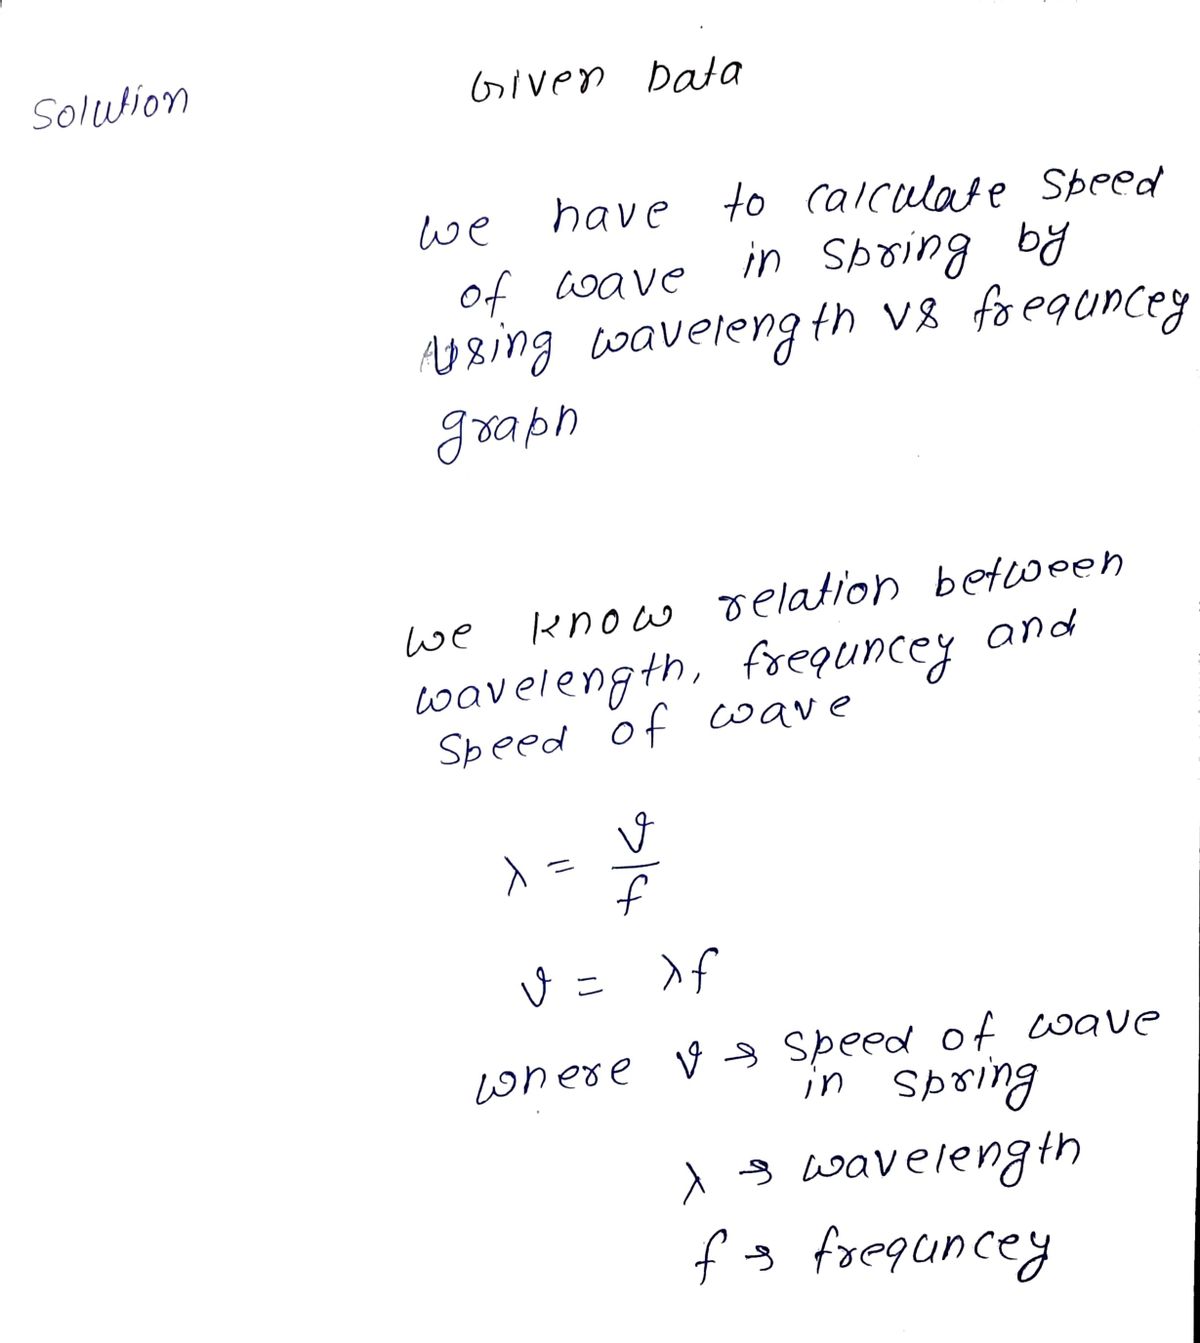
The graph below represents the relationship between wavelength and frequency of waves traveling through a spring. Wavelength vs. Frequency 6.0 5.0 4.0 3.0 2.0 1.0 O 1.0 20 3.0 4.0 5.0 6.0 Frequency (Hz) Calculate the speed of the waves in the spring. O 3.00 Hz • 1.66 m O All of the other answer choices O 5.00 m/s O 1.43 Hz • 3.50 m 5.00 Hz • 1.00 m Wavelength (m)
The graph below represents the relationship between wavelength and frequency of waves traveling through a spring. Wavelength vs. Frequency 6.0 5.0 4.0 3.0 2.0 1.0 O 1.0 20 3.0 4.0 5.0 6.0 Frequency (Hz) Calculate the speed of the waves in the spring. O 3.00 Hz • 1.66 m O All of the other answer choices O 5.00 m/s O 1.43 Hz • 3.50 m 5.00 Hz • 1.00 m Wavelength (m)

Related questions
Question
19

Transcribed Image Text:The graph below represents the relationship between wavelength and frequency of
waves traveling through a spring.
Wavelength vs. Frequency
6.0
5.0
4.0
3.0
2.0
1.0
1.0 2.0 3.0 4.0 5.0 6.0
Frequency (Hz)
Calculate the speed of the waves in the spring.
3.00 Hz • 1.66 m
O All of the other answer choices
5.00 m/s
O 1.43 Hz • 3.50 m
5.00 Hz • 1.00 m
Wavelength (m)
Expert Solution
Step 1

Trending now
This is a popular solution!

Step by step
Solved in 2 steps with 2 images
