The function f(x) = x connecting the points on f where x = values of c which satisfy the conclusion of the Mean Value Theorem for f on the closed interval 2


Minimization
In mathematics, traditional optimization problems are typically expressed in terms of minimization. When we talk about minimizing or maximizing a function, we refer to the maximum and minimum possible values of that function. This can be expressed in terms of global or local range. The definition of minimization in the thesaurus is the process of reducing something to a small amount, value, or position. Minimization (noun) is an instance of belittling or disparagement.
Maxima and Minima
The extreme points of a function are the maximum and the minimum points of the function. A maximum is attained when the function takes the maximum value and a minimum is attained when the function takes the minimum value.
Derivatives
A derivative means a change. Geometrically it can be represented as a line with some steepness. Imagine climbing a mountain which is very steep and 500 meters high. Is it easier to climb? Definitely not! Suppose walking on the road for 500 meters. Which one would be easier? Walking on the road would be much easier than climbing a mountain.
Concavity
In calculus, concavity is a descriptor of mathematics that tells about the shape of the graph. It is the parameter that helps to estimate the maximum and minimum value of any of the functions and the concave nature using the graphical method. We use the first derivative test and second derivative test to understand the concave behavior of the function.
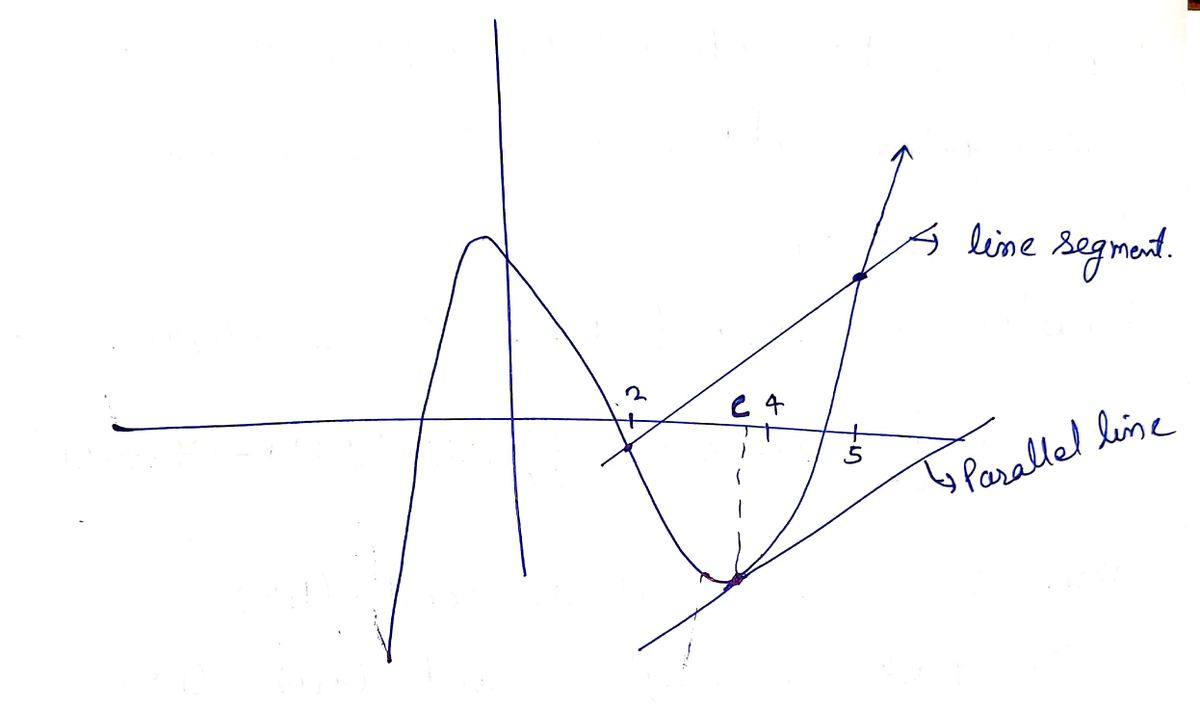
![**Title: Application of the Mean Value Theorem**
**Description:**
The function \( f(x) = x^3 - 4x^2 - 7x + 20 \) is graphed below. Your task is to plot a line segment connecting the points on \( f \) where \( x = 2 \) and \( x = 5 \). Afterwards, determine all values of \( c \) which satisfy the conclusion of the Mean Value Theorem for \( f \) on the closed interval \( 2 \leq x \leq 5 \).
**Instructions:**
- Plot a line by clicking in two locations on the graph.
- Click the line to delete it.
**Graph Explanation:**
- The graph shows the curve of the function \( f(x) = x^3 - 4x^2 - 7x + 20 \).
- The x-axis ranges from -10 to 10, and the y-axis ranges from -50 to 50.
- Key points on the graph are marked at notable intervals.
- Use this visual to identify and connect the points \( (2, f(2)) \) and \( (5, f(5)) \).
**Objective:**
Utilize the Mean Value Theorem:
The Mean Value Theorem states that if a function \( f \) is continuous on the closed interval \([a, b]\) and differentiable on the open interval \((a, b)\), there exists at least one number \( c \) in the open interval \((a, b)\) such that:
\[
f'(c) = \frac{f(b) - f(a)}{b - a}
\]
Apply this principle to find the values of \( c \) within the interval \( 2 < x < 5 \).](/v2/_next/image?url=https%3A%2F%2Fcontent.bartleby.com%2Fqna-images%2Fquestion%2F45a38a2f-ec58-4f95-82e3-179142041ecb%2F488c1a46-3a2b-488f-91db-2f8ba722b5aa%2Fe1y82ph_processed.jpeg&w=3840&q=75)

Step by step
Solved in 2 steps with 2 images


