The following three independent random samples are obtained from three normally distributed populations with equal variance. The dependent variable is starting hourly wage, and the groups are the types of position (internship, co-op, work study). Group 2: Co-op Group 3: Work Study Group 1: Internship 10 10.5 11.25 11 9.25 10.25 9.75 13.25 10.5 12.5 10.5 10.75 Use technology to conduct a one-factor ANOVA to determine if the group means are equal using a = 0.01. Group means (report to 2 decimal places): Group 1: Internship: Group 2: Co-op: Group 3: Work Study: ANOVA summary statistics: F-ratio = (report accurate to 3 decimal places) 12.25 10.5 10.75 11.5 10 10.5 p = (report accurate to 4 decimal places)
The following three independent random samples are obtained from three normally distributed populations with equal variance. The dependent variable is starting hourly wage, and the groups are the types of position (internship, co-op, work study). Group 2: Co-op Group 3: Work Study Group 1: Internship 10 10.5 11.25 11 9.25 10.25 9.75 13.25 10.5 12.5 10.5 10.75 Use technology to conduct a one-factor ANOVA to determine if the group means are equal using a = 0.01. Group means (report to 2 decimal places): Group 1: Internship: Group 2: Co-op: Group 3: Work Study: ANOVA summary statistics: F-ratio = (report accurate to 3 decimal places) 12.25 10.5 10.75 11.5 10 10.5 p = (report accurate to 4 decimal places)

MATLAB: An Introduction with Applications
6th Edition
ISBN:9781119256830
Author:Amos Gilat
Publisher:Amos Gilat
Chapter1: Starting With Matlab
Section: Chapter Questions
Problem 1P

Related questions
Question

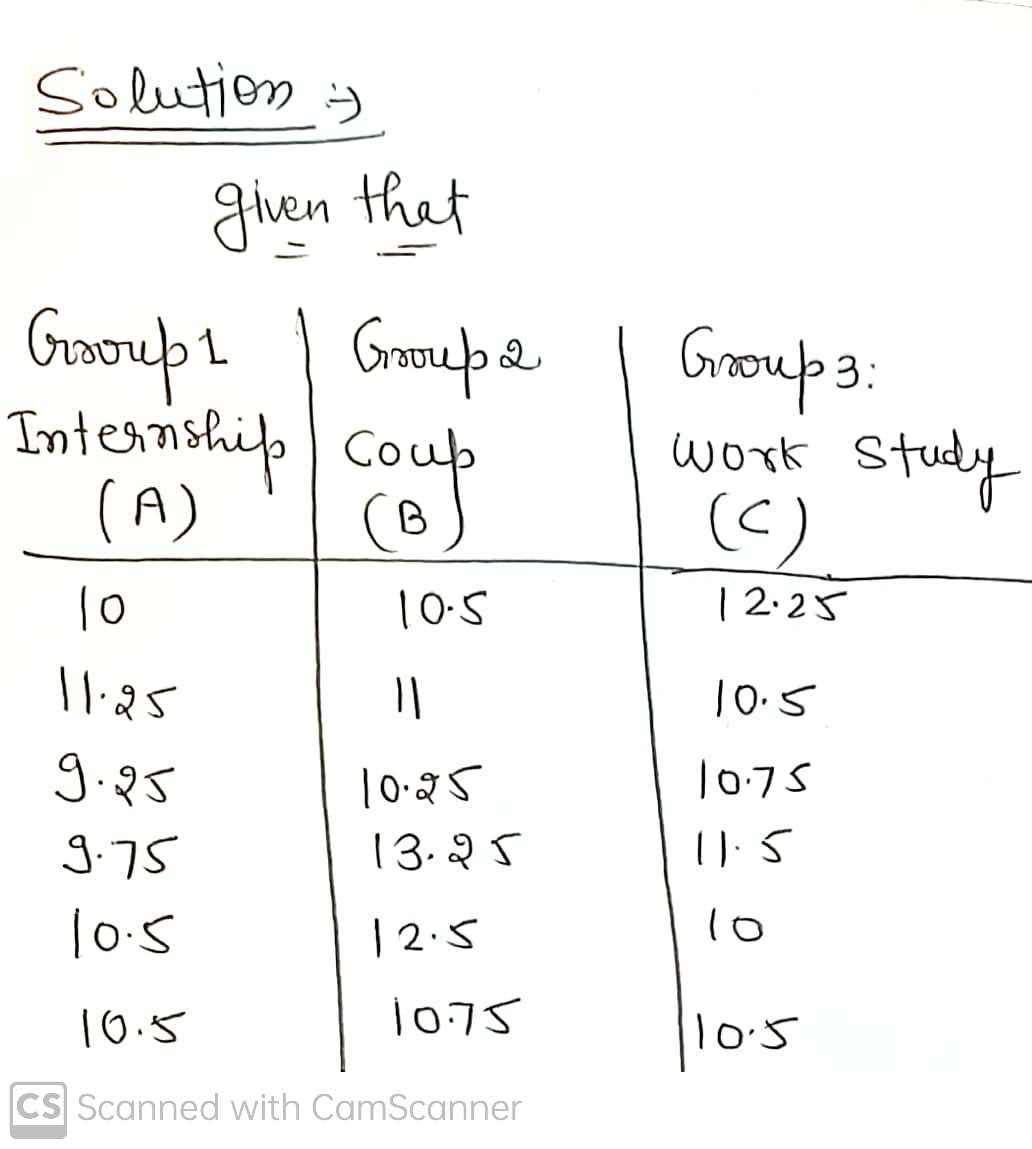
Transcribed Image Text:The image presents data and instructions for conducting a one-factor ANOVA to compare starting hourly wages across three different types of positions: internships, co-ops, and work-study jobs.
**Data Table:**
- **Group 1: Internship**
- 10, 11.25, 9.25, 9.75, 10.5, 10.5
- **Group 2: Co-op**
- 10.5, 11, 10.25, 13.25, 12.5, 10.75
- **Group 3: Work Study**
- 12.25, 10.5, 10.75, 11.5, 10, 10.5
The objective is to determine if the mean starting hourly wages are equal across the three groups using a significance level (\(\alpha\)) of 0.01.
**Instructions:**
1. **Calculate Group Means:**
- Find the mean for each group and report to two decimal places.
2. **Conduct One-Factor ANOVA:**
- Use technology to calculate the ANOVA summary statistics.
- Report the \( F \)-ratio to three decimal places.
- Report the \( p \)-value to four decimal places.
**Conclusion:**
- Evaluating whether the \( p \)-value is less than 0.01 will determine if there is a significant difference between the group means.
Expert Solution
Step 1
Given that
We have to find
Groups means
F statistic value
P value

Step by step
Solved in 5 steps with 4 images

Recommended textbooks for you
MATLAB: An Introduction with Applications
Statistics
ISBN:
9781119256830
Author:
Amos Gilat
Publisher:
John Wiley & Sons Inc

Probability and Statistics for Engineering and th…
Statistics
ISBN:
9781305251809
Author:
Jay L. Devore
Publisher:
Cengage Learning

Statistics for The Behavioral Sciences (MindTap C…
Statistics
ISBN:
9781305504912
Author:
Frederick J Gravetter, Larry B. Wallnau
Publisher:
Cengage Learning
MATLAB: An Introduction with Applications
Statistics
ISBN:
9781119256830
Author:
Amos Gilat
Publisher:
John Wiley & Sons Inc
Probability and Statistics for Engineering and th…
Statistics
ISBN:
9781305251809
Author:
Jay L. Devore
Publisher:
Cengage Learning
Statistics for The Behavioral Sciences (MindTap C…
Statistics
ISBN:
9781305504912
Author:
Frederick J Gravetter, Larry B. Wallnau
Publisher:
Cengage Learning

Elementary Statistics: Picturing the World (7th E…
Statistics
ISBN:
9780134683416
Author:
Ron Larson, Betsy Farber
Publisher:
PEARSON

The Basic Practice of Statistics
Statistics
ISBN:
9781319042578
Author:
David S. Moore, William I. Notz, Michael A. Fligner
Publisher:
W. H. Freeman

Introduction to the Practice of Statistics
Statistics
ISBN:
9781319013387
Author:
David S. Moore, George P. McCabe, Bruce A. Craig
Publisher:
W. H. Freeman