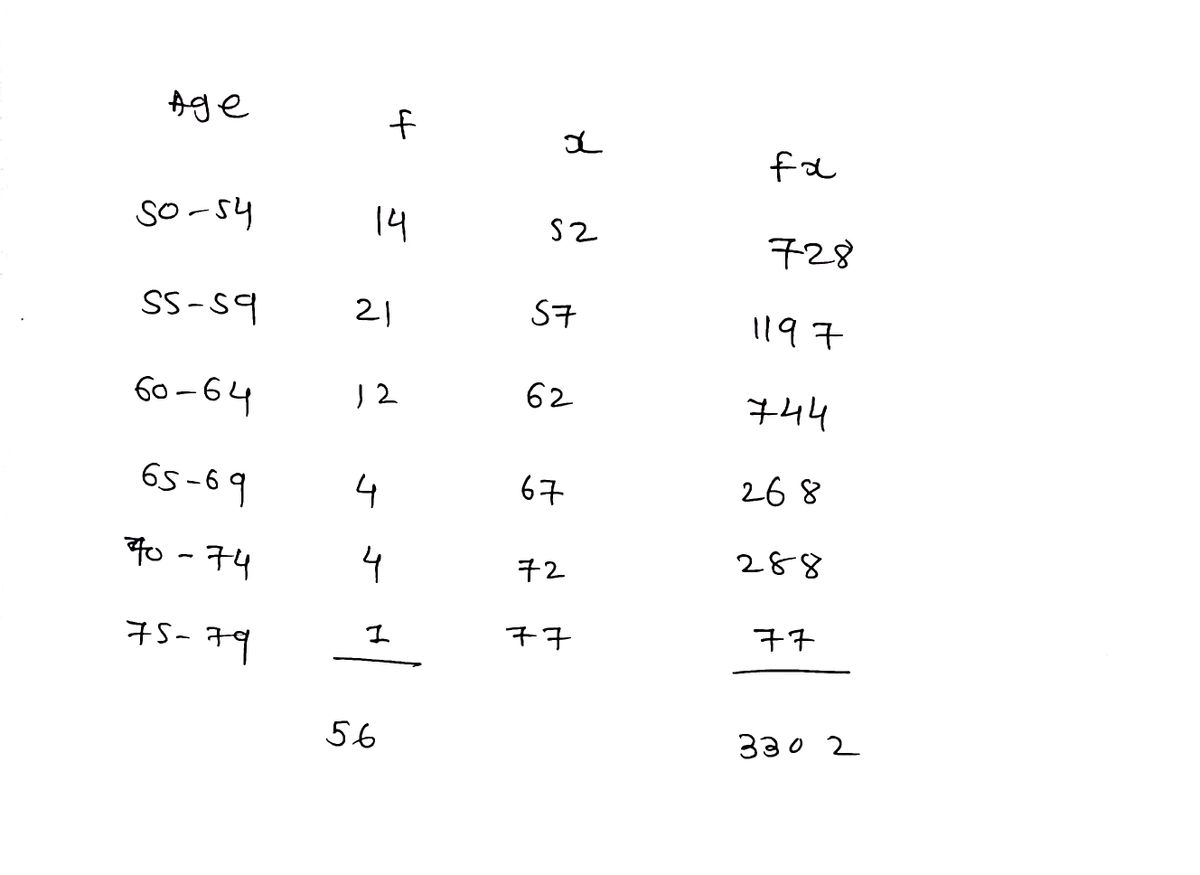
The following table summarizes the ages of a sample of 56 adults that are members of a certain social club. Use the frequency distribution table to estimate their mean age. Age Frequency 50 54 14 55 59 21 60 - 64 12 65- 69 70 - 74 75-79 Mean age
The following table summarizes the ages of a sample of 56 adults that are members of a certain social club. Use the frequency distribution table to estimate their mean age. Age Frequency 50 54 14 55 59 21 60 - 64 12 65- 69 70 - 74 75-79 Mean age

A First Course in Probability (10th Edition)
10th Edition
ISBN:9780134753119
Author:Sheldon Ross
Publisher:Sheldon Ross
Chapter1: Combinatorial Analysis
Section: Chapter Questions
Problem 1.1P: a. How many different 7-place license plates are possible if the first 2 places are for letters and...

Related questions
Question

Transcribed Image Text:Section 3.3 Homework
Score: 3.5/5
4/5 answered
Question 4
The following table summarizes the ages of a sample of 56 adults that are members of a certain social
club. Use the frequency distribution table to estimate their mean age.
Age
Frequency
50 54
14
55 59
21
60 64
12
65 - 69
4
70 - 74
4.
75 79
Mean age =
Report answer accurate to one decimal place.
Submit Question
73°F
rch
Expert Solution
Step 1

Trending now
This is a popular solution!

Step by step
Solved in 2 steps with 2 images

Recommended textbooks for you
A First Course in Probability (10th Edition)
Probability
ISBN:
9780134753119
Author:
Sheldon Ross
Publisher:
PEARSON

A First Course in Probability (10th Edition)
Probability
ISBN:
9780134753119
Author:
Sheldon Ross
Publisher:
PEARSON