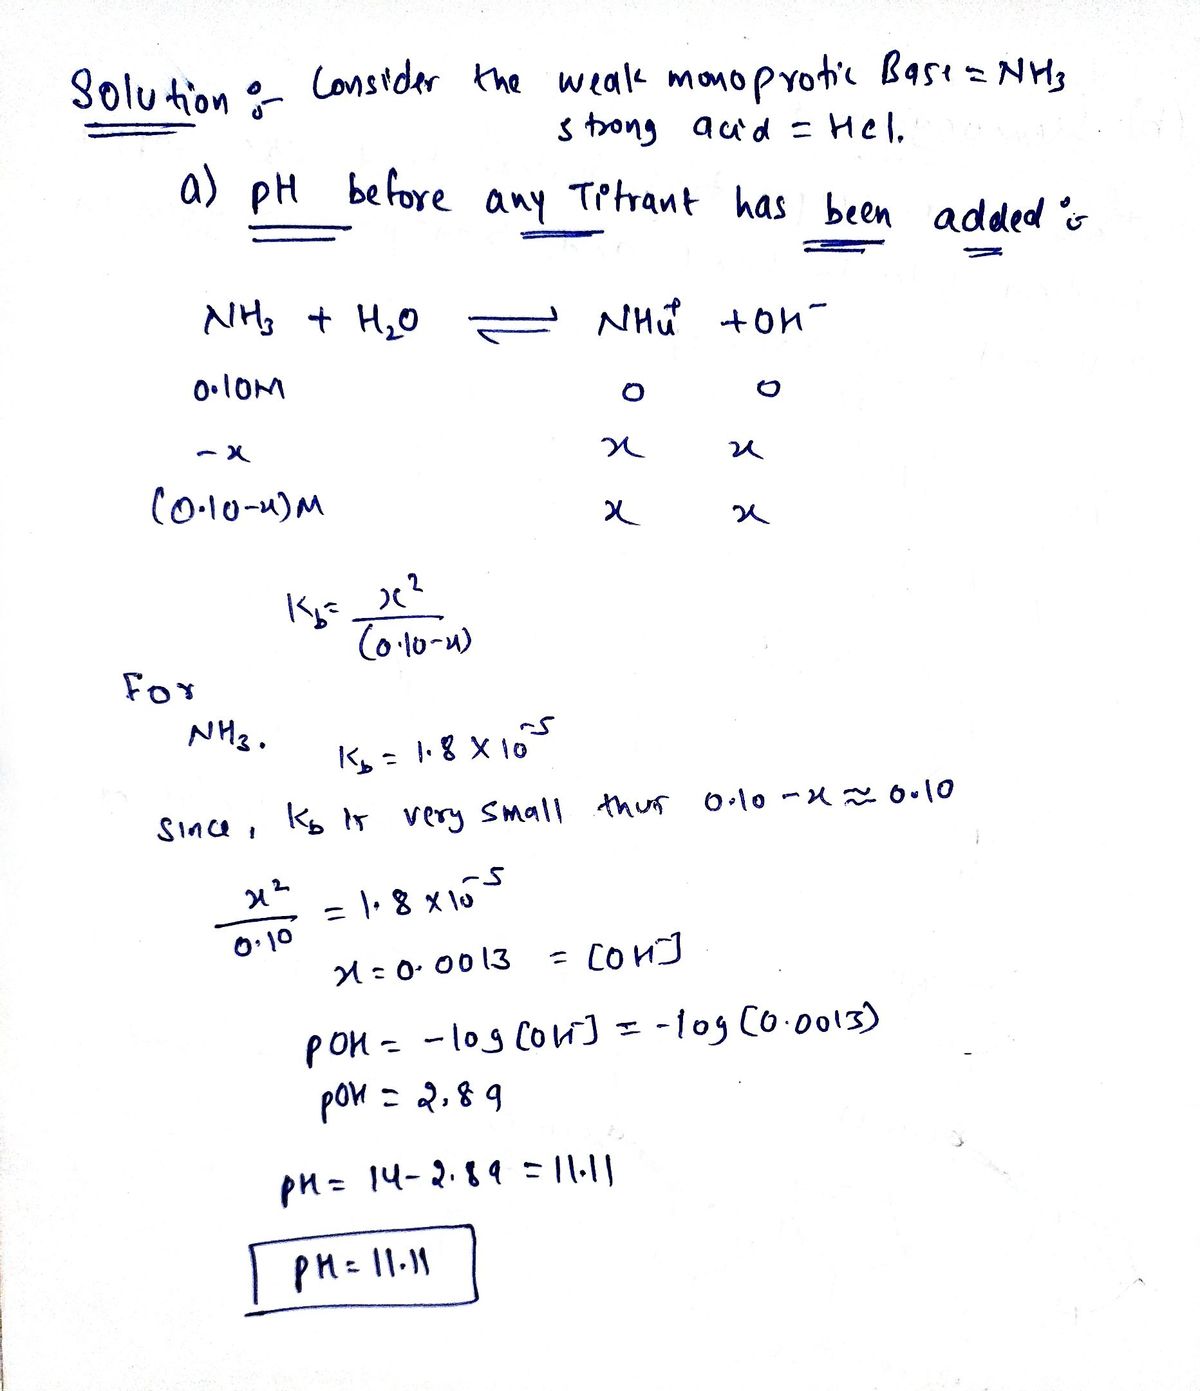
The following pH curve is for the titration of 20.0 mL of a 0.10 M solution of a weak monoprotic base with a 0.10 M solution of a strong monoprotic acid. (a) What is the pH before any titrant has been added? (b) Wh Data points at 1 mL increments. the pH the midpoint the titration? (c) What is the pH at the equivalence point? (d) What is the value of K, for the weak base? 12.0 10.0 8.0 픔 6.0 4.0 2.0 0.0 0.0 10.0 20.0 PODOLAAAAAÀÀÀÀÀÀÀÀÀOOOOOOO 30.0 Volume of titrant (mL) 40.0 50.0
The following pH curve is for the titration of 20.0 mL of a 0.10 M solution of a weak monoprotic base with a 0.10 M solution of a strong monoprotic acid. (a) What is the pH before any titrant has been added? (b) Wh Data points at 1 mL increments. the pH the midpoint the titration? (c) What is the pH at the equivalence point? (d) What is the value of K, for the weak base? 12.0 10.0 8.0 픔 6.0 4.0 2.0 0.0 0.0 10.0 20.0 PODOLAAAAAÀÀÀÀÀÀÀÀÀOOOOOOO 30.0 Volume of titrant (mL) 40.0 50.0

Chemistry
10th Edition
ISBN:9781305957404
Author:Steven S. Zumdahl, Susan A. Zumdahl, Donald J. DeCoste
Publisher:Steven S. Zumdahl, Susan A. Zumdahl, Donald J. DeCoste
Chapter1: Chemical Foundations
Section: Chapter Questions
Problem 1RQ: Define and explain the differences between the following terms. a. law and theory b. theory and...

Related questions

Question

Transcribed Image Text:The following pH curve is for the titration of 20.0 mL of a 0.10 M solution of a weak monoprotic base with a 0.10 M solution of a strong monoprotic acid.
**Graph Description:**
- **Y-Axis (Vertical):** Represents the pH level, ranging from 0.0 to 12.0.
- **X-Axis (Horizontal):** Represents the Volume of titrant in mL, ranging from 0.0 to 50.0.
- The curve starts at a high pH and decreases as the volume of titrant increases. The initial section of the curve is relatively flat, indicating that the pH changes slowly. As the titration proceeds, there is a steep drop in pH, indicating the equivalence point. After the equivalence point, the curve flattens out again, showing a more gradual pH decrease.
**Data points are plotted at 1 mL increments.**
**Questions:**
(a) What is the pH before any titrant has been added?
(b) What is the pH at the midpoint of the titration?
(c) What is the pH at the equivalence point?
(d) What is the value of \( K_b \) for the weak base?
Expert Solution
Step 1

Step by step
Solved in 3 steps with 3 images

Knowledge Booster


Learn more about
Need a deep-dive on the concept behind this application? Look no further. Learn more about this topic, chemistry and related others by exploring similar questions and additional content below.Recommended textbooks for you
Chemistry
Chemistry
ISBN:
9781305957404
Author:
Steven S. Zumdahl, Susan A. Zumdahl, Donald J. DeCoste
Publisher:
Cengage Learning

Chemistry
Chemistry
ISBN:
9781259911156
Author:
Raymond Chang Dr., Jason Overby Professor
Publisher:
McGraw-Hill Education

Principles of Instrumental Analysis
Chemistry
ISBN:
9781305577213
Author:
Douglas A. Skoog, F. James Holler, Stanley R. Crouch
Publisher:
Cengage Learning
Chemistry
Chemistry
ISBN:
9781305957404
Author:
Steven S. Zumdahl, Susan A. Zumdahl, Donald J. DeCoste
Publisher:
Cengage Learning
Chemistry
Chemistry
ISBN:
9781259911156
Author:
Raymond Chang Dr., Jason Overby Professor
Publisher:
McGraw-Hill Education
Principles of Instrumental Analysis
Chemistry
ISBN:
9781305577213
Author:
Douglas A. Skoog, F. James Holler, Stanley R. Crouch
Publisher:
Cengage Learning

Organic Chemistry
Chemistry
ISBN:
9780078021558
Author:
Janice Gorzynski Smith Dr.
Publisher:
McGraw-Hill Education

Chemistry: Principles and Reactions
Chemistry
ISBN:
9781305079373
Author:
William L. Masterton, Cecile N. Hurley
Publisher:
Cengage Learning

Elementary Principles of Chemical Processes, Bind…
Chemistry
ISBN:
9781118431221
Author:
Richard M. Felder, Ronald W. Rousseau, Lisa G. Bullard
Publisher:
WILEY