The following graph shows the approximate number (in thousands) of people who immigrated to Ireland during the period 2010-2014 (t is time in years since 2010). 1(t) 70 65 60 55 50 45 40 42 53 0 53 56 2 61 1 3 (a) During which 2-year interval(s) was the magnitude of the average rate of change of I(t) greatest? (Select all that apply.) 2010-2012 2011-2013 2012-2014 i Interpret your answer by referring to the rate of change. During the 2-year interval(s) with the largest magnitude, immigration to Ireland was increasing at an average rate of (b) During which 2-year interval(s) was the magnitude of the average rate of change of I(t) least? (Select all that apply.) 2010-2012 2011-2013 2012-2014 Interpret your answer by referring to the rate of change. During the 2-year interval(s) with the least magnitude, immigration to Ireland was increasing at an average rate of people per year. people per year.
The following graph shows the approximate number (in thousands) of people who immigrated to Ireland during the period 2010-2014 (t is time in years since 2010). 1(t) 70 65 60 55 50 45 40 42 53 0 53 56 2 61 1 3 (a) During which 2-year interval(s) was the magnitude of the average rate of change of I(t) greatest? (Select all that apply.) 2010-2012 2011-2013 2012-2014 i Interpret your answer by referring to the rate of change. During the 2-year interval(s) with the largest magnitude, immigration to Ireland was increasing at an average rate of (b) During which 2-year interval(s) was the magnitude of the average rate of change of I(t) least? (Select all that apply.) 2010-2012 2011-2013 2012-2014 Interpret your answer by referring to the rate of change. During the 2-year interval(s) with the least magnitude, immigration to Ireland was increasing at an average rate of people per year. people per year.

Advanced Engineering Mathematics
10th Edition
ISBN:9780470458365
Author:Erwin Kreyszig
Publisher:Erwin Kreyszig
Chapter2: Second-order Linear Odes
Section: Chapter Questions
Problem 1RQ

Related questions
Question

Transcribed Image Text:The following graph shows the approximate number (in thousands) of people who immigrated to Ireland during the period 2010-2014 (t is time in years since 2010).
I(t)
70
65
60
55
50
45
40
42
0
53
53
56
61
1
2
3
4 Ⓡi
(a) During which 2-year interval(s) was the magnitude of the average rate of change of I(t) greatest? (Select all that apply.)
2010-2012
2011-2013
2012-2014
Interpret your answer by referring to the rate of change.
During the 2-year interval(s) with the largest magnitude, immigration to Ireland was increasing at an average rate of
(b) During which 2-year interval(s) was the magnitude of the average rate of change of I(t) least? (Select all that apply.)
2010-2012
2011-2013
2012-2014
Interpret your answer by referring to the rate of change.
During the 2-year interval(s) with the least magnitude, immigration to Ireland was increasing at an average rate of
people per year.
people per year.
Expert Solution
Step 1
Given that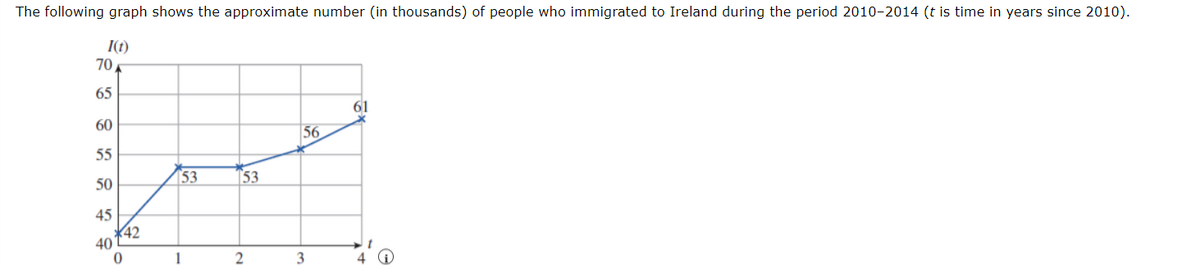

Step by step
Solved in 4 steps with 1 images

Recommended textbooks for you
Advanced Engineering Mathematics
Advanced Math
ISBN:
9780470458365
Author:
Erwin Kreyszig
Publisher:
Wiley, John & Sons, Incorporated

Numerical Methods for Engineers
Advanced Math
ISBN:
9780073397924
Author:
Steven C. Chapra Dr., Raymond P. Canale
Publisher:
McGraw-Hill Education

Introductory Mathematics for Engineering Applicat…
Advanced Math
ISBN:
9781118141809
Author:
Nathan Klingbeil
Publisher:
WILEY
Advanced Engineering Mathematics
Advanced Math
ISBN:
9780470458365
Author:
Erwin Kreyszig
Publisher:
Wiley, John & Sons, Incorporated
Numerical Methods for Engineers
Advanced Math
ISBN:
9780073397924
Author:
Steven C. Chapra Dr., Raymond P. Canale
Publisher:
McGraw-Hill Education
Introductory Mathematics for Engineering Applicat…
Advanced Math
ISBN:
9781118141809
Author:
Nathan Klingbeil
Publisher:
WILEY

Mathematics For Machine Technology
Advanced Math
ISBN:
9781337798310
Author:
Peterson, John.
Publisher:
Cengage Learning,

