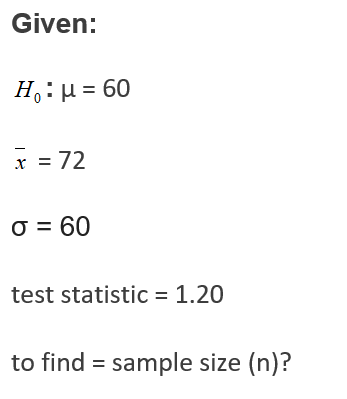
The following details are available with regard to a test of hypothesis for the population mean: H0:μ = 60, σ = 60 x̅ = 72, test statistic = 1.20 what is the sample size?


Q: Find the value of the test statistic z using z =p - ppqn.A claim is made that the proportion of…
A:
Q: Test the claim about the population mean y, at the given level of significance using the given…
A:
Q: Test the claim about the population mean, µ, at the given level of significance using the given…
A: The summary of the statistics is, The null and alternative hypothesis is, The level of…
Q: Find the standardized test statistic, z to test the hypothesis that p1 = p2. Use α = 0.05. The…
A:
Q: Let X be the number of material anomalies occurring in a particular region of an aircraft…
A:
Q: Determine the type of distribution that should be used to test a hypothesis about a population…
A: Given Data: p ˆ = 0.35 n=700
Q: The summary statistics are n = 199, x = 6.19, s = 1.99. Use a 0.01 significance level to test the…
A:
Q: Find the standard error, t statics Sample variance = .67 Sample size = 30 Population size = 60…
A: Given information- Sample variance, s2 = .67 So, sample standard deviation, s = 0.819 Sample size, n…
Q: Find the standard error of the estimate for the difference in mean comfortable room temperatures…
A:
Q: In order to construct the 95% confidence interval, you choose which formula? O x ±1.645 × OT ±1.96 x…
A:
Q: Given below are the BMI statistics for random samples of males and females. 0.05. Test the claim…
A: From the provided information, n1=40x1=28.44075s1=7.394076n2=40x2=26.6005s2=5.359442α=0.05
Q: EVALUATE THIS PROBLEM: 1. Given the scores of Statistics and Probability 5-item quiz; 0, 1, 2, 3 and…
A: We have given data are 0,1,2,3,4 x x2 0 0 1 1 2 4 3 9 4 16 5 25 ∑x = 15 ∑x2 = 55
Q: Given the following Normal curves, choose the choice that correctly describes the relationship…
A: The two given graphs are normally distributed (Bell shaped) The graph 1 spike is not that much…
Q: Q1. Erythrocytes were examined by light microscopy and found to have the following diameter: 4.7,…
A: Mean is the measure of central tendency. It is calculated by adding all the values and divide it by…
Q: Test Statistics Value = -2.30 Degrees of freedom= 24 Level of Significance= 0.01 What is the…
A: From the provided information, Test statistic = -2.30 Degrees of freedom = 24 Level of significance…
Q: Determine the standardized test statistic, z, to test the claim about the population proportion p >…
A: The claim is p>0.700, the sample size is 50, sample proportion is 0.72, and alpha is 0.10.
Q: Would you use a one-sample, paired-sample, or independent-sample t-test in the following situations?…
A: From given, A lab technician tests the specimen 10 times using an assay kit. Let we know about…
Q: Use the following two control charts that result from testing batches of newly manufactured aircraft…
A:
Q: We wish to estimate the difference in mean GPAS at two different colleges. Consider the following…
A: Given Information: School A: x¯1=4.05 s1=0.03 n1=80 School B: x¯2=3.95 s2=0.04 n2=90 Confidence…
Q: Two independent samples from normal distributions are being compared. The sample data are summarized…
A:
Q: alculate the SEM for the following data: a. Population standard deviation = 25 b. Sample size = 36
A:
Q: The mean age of a group of 15 out of all MPC students studying at the Math Learning Center on a…
A: We have to find correct option.
Q: The recidivism rate for convicted sex offenders is 13%. A warden suspects that this percent is…
A: Given : X = 55 n = 395
Q: For the following population of N= 6 scores X= 3,1,4,3,3,4 A) sketch a histogram showing the…
A:
Q: Assume the weight of infants born in the UK is normally distributed, with a population means of 2.27…
A: We have given that Mean(µ) = 2.27 Standard deviations (σ) = 1.23X ~ N (µ, σ )= N(2.27,1.23)
Q: Margin of Standard Required Level Error D Deviation (O) Sample Size 90% 0.5 unit 12 95% 0.09 unit…
A: Givenfor 90% confidence levelMargin of error(E)=0.5standard deviation(σ)=12
Q: ample standard deviation: 19.0, 24.0, 26.0, 31.0, 29.0, 20.0?
A: X is a discrete variable with sample standard deviation s and range r. The relationship between s…
Q: To determine if their 14 oz filling machine is properly adjusted, Harvey Soft Drinks has decided to…
A: The provided information is as follows:The data set is given in the example.The sample size is .
Q: Calculate the z – score of the following data: Sample mean: 60 Standard deviation: 5 Select…
A: Given problem Given that We have to find the z – score of the following data . We know the…
Q: Test the claim about the population mean, p, at the given level of significance using the given…
A:
Q: The following data was collected during the Framingham Heart Study. Is there a statistically…
A: Let men and women are the sample1 and sample 2 respectively.
Q: Find the standardized test statistic, z to test the claim that p, = p2. The sample statistics listed…
A: The sample proportions are: The value of the pooled proportion is computed as :
Q: state the null and alternative hypotheses b. calculate the test statistic c. what are the df?…
A: a) claim: patients wants to compare the two different programmed designed for weight gain let us…
Q: 2.Which of the following is not needed to compute a t statistic? a. A hypothesized value for the…
A:
Q: Which of the following is NOT needed to calculate an independent samples t test-statistic? sample…
A: Solution-: Which of the following is NOT need to calculate an independent t-test statistic? (1)…
The following details are available with regard to a test of hypothesis for the population mean:
H0:μ = 60, σ = 60
x̅ = 72, test statistic = 1.20
what is the

Step by step
Solved in 2 steps with 2 images


- Use the following ANOVA table to answer the question. Source Regression Error Total DF MS SS 355.22 177.61 10.91 2 76.38 431.60 7 How many observations were in the data set used to create this model? (i.e. what is n?) 18 15 10 9.Given a 95% C.I. = (34.14 mm, 36.02 mm) for a sample of Wooly Bear caterpillar lengths (preceding problem), address the following. Based upon the above information, I am _____ % confident that the 95% C.I. contains the sample mean.Samples of body temperatures were taken from both men and women. The information from the samples is summarized below. Use a 0.05 significance level to to test the claim that men and women have different mean body temperatures. Men: n₁ = 15; 1 = 98.38° F; s₁ = 0.45°F Women: n2=91; 2 = 98.17°F; $2 = 0.65° F a. On your Work Upload or Calculations page, write down your hypotheses. Label which hypothesis is the claim. b. The test statistic is c. The critical value is . (Round to 3 decimal places.) (Round to 3 decimal places.) d. The p-value is (Round to 3 decimal places.) e. On your Work Upload or Calculations page, show how you made your decision using either the traditional or p-value method. The correct decision is to 1: Reject the null hypothesis, or 2: Fail to reject the null hypothesis. box.) (Type 1 or 2 in the f. On your Work Upload or Calculations page, write your conclusion/results summary. (Use the standard language about evidence and support of claims.)
- The following data was collected during the Framingham Heart Study. Is there a statistically significant difference in mean SBP between men and women using a 5% level of significance? Sample size Mean Standard Deviation Men 1623 128.2 17.5 Women 1911 126.5 20.1This is part A: population mean= 30.23 population standard deviation 13.84 sample size= 25 sample mean 33.17 How likely were we to draw a sample from part A, given the true average weight gain in the population was in fact 30.23?For a study of two independent samples: Sample 1: mean = 18.1, standard deviation = 2.5, sample size = 30; Sample 2: mean = 19, standard deviation = 2.0; sample size : 54. = a. Calculate t-obtained ONLY (do not interpret). a. How many degrees of freedom are there?
- Listed below are the lead concentrations in mu g/g measured in different traditional medicines. Use a 0.05 significance level to test the claim that the mean lead concentration for all such medicines is less than 18 mu g/g. Assume that the sample is a simple random sample. a. Determine the test statistic. (Round to two decimal places as needed.) b. Determine the P-value. (Round to three decimal places as needed.)Below are the SPSS results of a related (dependent) samples t-test. Use the SPSS results to answer Questions 5, 6, and 7. Paired Samples Statistics Mean N Std. Deviation Std. Error Mean Pair 1 Statistics Posttest 57.1250 40 16.73962 2.64677 Statistics Pretest 49.9250 40 15.09014 2.38596 Paired Samples Test Paired Differences t df Sig. (2-tailed) Mean Std. Deviation Std. Error Mean Pair 1 Statistics Posttest - Statistics Pretest 7.200 12.313 ( a ) ( b ) ( c ) .001 Find the mean of the differences ( and standard deviation of the differences (Sd). Replace “a,” “b,” and “c” in the table above with the correct values. Round to the third decimal place. Do you think there is a statistically significant difference between the pretest and posttest at the .05 level of significance?The next five questions refer to the following scenario: • sample mean T = 10 • sample size n = 100 • population standard deviation O = 4
- Kenneth, a competitor in cup stacking, claims that his average stacking time is 8.2 seconds. During a practice session, Kenneth has a sample stacking time mean of 7.8 seconds based on 11 trials. At the 4% significance level, does the data provide sufficient evidence to conclude that Kenneth's mean stacking time is less than 8.2 seconds? Accept or reject the hypothesis given the sample data below. H0:μ=8.2 seconds; Ha:μ<8.2 seconds α=0.04 (significance level) z0=−1.75 p=0.0401 Select the correct answer below: a. Do not reject the null hypothesis because the p-value 0.0401 is greater than the significance level α=0.04. b. Reject the null hypothesis because the p-value 0.0401 is greater than the significance level α=0.04. c. Reject the null hypothesis because the value of z is negative. d. Reject the null hypothesis because |−1.75|>0.04. e. Do not reject the null hypothesis because |−1.75|>0.04.Answer the last questionDetermine the point of estimate of the population mean and margin of error from the given information: Lower Bound: 5 Upper Bound: 23 Question 4 options: x¯= 15 E = 10 x¯= 12 E = 9 x¯= 13.5 E = 9 x¯= 14 E = 9
