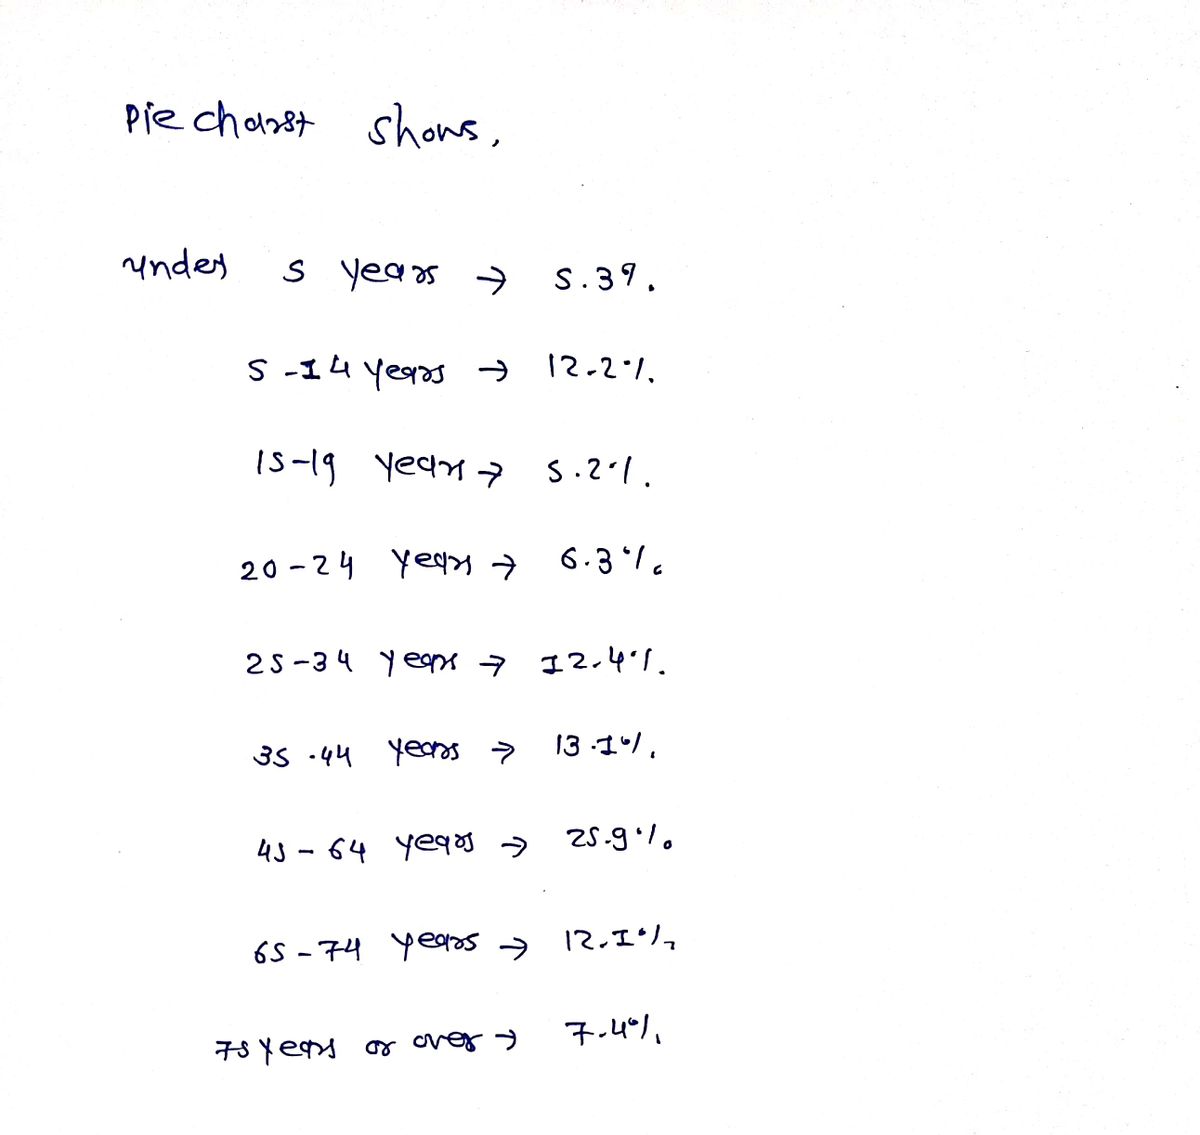
The estimated percent distribution of a certain country's population for 2025 is shown in the accompanying pie chart. Find the probability of each event listed in parts (a) through (d) below. W Click the icon to view the pie chart. (a) Randomly selecting someone who is under 5 years old Pie chart - X The probability is 5.3 %. (Round to one decimal place as needed.) National Age Distribution (b) Randomly selecting someone who is 45 years old or over The probability is %. (Round to one decimal place as needed.) I Under 5 years, 5.3% I 5-14 years, 12.2% O 15-19 years, 5.2% O 20-24 years, 6.3% 25-34 years, 12.4% I 35-44 years, 13.1% 45-64 years, 25.9% O 65-74 years, 12.1% |75 years or over, 7.4% Incorre Print Done
The estimated percent distribution of a certain country's population for 2025 is shown in the accompanying pie chart. Find the probability of each event listed in parts (a) through (d) below. W Click the icon to view the pie chart. (a) Randomly selecting someone who is under 5 years old Pie chart - X The probability is 5.3 %. (Round to one decimal place as needed.) National Age Distribution (b) Randomly selecting someone who is 45 years old or over The probability is %. (Round to one decimal place as needed.) I Under 5 years, 5.3% I 5-14 years, 12.2% O 15-19 years, 5.2% O 20-24 years, 6.3% 25-34 years, 12.4% I 35-44 years, 13.1% 45-64 years, 25.9% O 65-74 years, 12.1% |75 years or over, 7.4% Incorre Print Done

MATLAB: An Introduction with Applications
6th Edition
ISBN:9781119256830
Author:Amos Gilat
Publisher:Amos Gilat
Chapter1: Starting With Matlab
Section: Chapter Questions
Problem 1P

Related questions
Question

Transcribed Image Text:The estimated percent distribution of a certain country's population for 2025 is shown in the accompanying pie chart. Find the probability of each event listed in parts (a)
through (d) below.
W Click the icon to view the pie chart.
(a) Randomly selecting someone who is under 5 years old
Pie chart
The probability is 5.3 %.
(Round to one decimal place as needed.)
National Age Distribution
(b) Randomly selecting someone who is 45 years old or over
I Under 5 years, 5.3%
I 5-14 years, 12.2%
O 15-19 years, 5.2%
%.
The probability is
(Round to one decimal place as needed.)
O 20-24 years, 6.3%
I 25-34 years, 12.4%
35-44 years, 13.1%
45-64 years, 25.9%
O 65-74 years, 12.1%
I 75 years or over, 7.4%
Incorre
Print
Done
Expert Solution
Step 1

Trending now
This is a popular solution!

Step by step
Solved in 2 steps with 2 images

Recommended textbooks for you
MATLAB: An Introduction with Applications
Statistics
ISBN:
9781119256830
Author:
Amos Gilat
Publisher:
John Wiley & Sons Inc

Probability and Statistics for Engineering and th…
Statistics
ISBN:
9781305251809
Author:
Jay L. Devore
Publisher:
Cengage Learning

Statistics for The Behavioral Sciences (MindTap C…
Statistics
ISBN:
9781305504912
Author:
Frederick J Gravetter, Larry B. Wallnau
Publisher:
Cengage Learning
MATLAB: An Introduction with Applications
Statistics
ISBN:
9781119256830
Author:
Amos Gilat
Publisher:
John Wiley & Sons Inc
Probability and Statistics for Engineering and th…
Statistics
ISBN:
9781305251809
Author:
Jay L. Devore
Publisher:
Cengage Learning
Statistics for The Behavioral Sciences (MindTap C…
Statistics
ISBN:
9781305504912
Author:
Frederick J Gravetter, Larry B. Wallnau
Publisher:
Cengage Learning

Elementary Statistics: Picturing the World (7th E…
Statistics
ISBN:
9780134683416
Author:
Ron Larson, Betsy Farber
Publisher:
PEARSON

The Basic Practice of Statistics
Statistics
ISBN:
9781319042578
Author:
David S. Moore, William I. Notz, Michael A. Fligner
Publisher:
W. H. Freeman

Introduction to the Practice of Statistics
Statistics
ISBN:
9781319013387
Author:
David S. Moore, George P. McCabe, Bruce A. Craig
Publisher:
W. H. Freeman