The durations (minutes) of 26 electric power outages in the community of Sonando Heights over the past five years are shown below. 33 45 26 65 26 11 61 8. 50 4 18 49 36 99 31 22 12 52 25 19 24 85 30 16 18 Click here for the Excel Data File (a) Find the mean, median, and mode. (Round your answers to 2 decimal places.) Descriptive Statistics Data Mean Median Mode (b) Are the mean and median about the same? the median. (Click to select) v, the mean is (Click to select) (c) Is the mode a good measure of center for this data set?

MATLAB: An Introduction with Applications
6th Edition
ISBN:9781119256830
Author:Amos Gilat
Publisher:Amos Gilat
Chapter1: Starting With Matlab
Section: Chapter Questions
Problem 1P
icon
Related questions
icon
Concept explainers
Topic Video
Question
The durations (minutes) of 26 electric power outages in the community of Sonando Heights over the past five years are shown below.
33
45
26
65
26
11
61
8
50
4
18
49
16
36
99
31
22
12
52
25
19
24
85
30
18
Click here for the Excel Data File
(a) Find the mean, median, and mode. (Round your answers to 2 decimal places.)
Descriptive Statistics
Data
Mean
Median
Mode
(b) Are the mean and median about the same?
(Click to select) v
the mean is (Click to select) vthe median.
(c) Is the mode a good measure of center for this data set?
O Yes
O No
Next >
12 of 19
7:19 PM
Prev
2/24/2021
ere to search
Chp
Transcribed Image Text:The durations (minutes) of 26 electric power outages in the community of Sonando Heights over the past five years are shown below. 33 45 26 65 26 11 61 8 50 4 18 49 16 36 99 31 22 12 52 25 19 24 85 30 18 Click here for the Excel Data File (a) Find the mean, median, and mode. (Round your answers to 2 decimal places.) Descriptive Statistics Data Mean Median Mode (b) Are the mean and median about the same? (Click to select) v the mean is (Click to select) vthe median. (c) Is the mode a good measure of center for this data set? O Yes O No Next > 12 of 19 7:19 PM Prev 2/24/2021 ere to search Chp
Expert Solution
Step 1

Mean: The mean is the sum of observations divided by the number of observations. that is,

Mean = x = xin

Notations:

Sample mean = x and

Population mean = μ

Mode: The mode is the value which is repeated maximum times.

we can denote it by Mo.

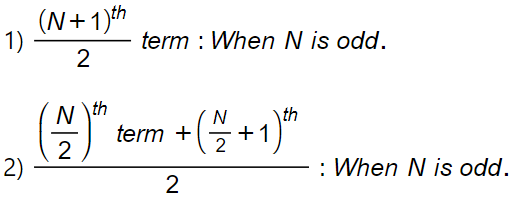
Median: The median is the value of the middlemost observation in the data set when the observation is arranged in increasing (or decreasing) order of their values.

Statistics homework question answer, step 1, image 1

trending now

Trending now

This is a popular solution!

steps

Step by step

Solved in 3 steps with 2 images

Blurred answer
Knowledge Booster
Centre, Spread, and Shape of a Distribution
Learn more about
Need a deep-dive on the concept behind this application? Look no further. Learn more about this topic, statistics and related others by exploring similar questions and additional content below.
Similar questions
Recommended textbooks for you
MATLAB: An Introduction with Applications
Statistics
ISBN:
9781119256830
Author:
Amos Gilat
Publisher:
John Wiley & Sons Inc
Probability and Statistics for Engineering and th…
Statistics
ISBN:
9781305251809
Author:
Jay L. Devore
Publisher:
Cengage Learning
Statistics for The Behavioral Sciences (MindTap C…
Statistics
ISBN:
9781305504912
Author:
Frederick J Gravetter, Larry B. Wallnau
Publisher:
Cengage Learning
Elementary Statistics: Picturing the World (7th E…
Statistics
ISBN:
9780134683416
Author:
Ron Larson, Betsy Farber
Publisher:
PEARSON
The Basic Practice of Statistics
Statistics
ISBN:
9781319042578
Author:
David S. Moore, William I. Notz, Michael A. Fligner
Publisher:
W. H. Freeman
Introduction to the Practice of Statistics
Statistics
ISBN:
9781319013387
Author:
David S. Moore, George P. McCabe, Bruce A. Craig
Publisher:
W. H. Freeman