Chemistry
10th Edition
ISBN:9781305957404
Author:Steven S. Zumdahl, Susan A. Zumdahl, Donald J. DeCoste
Publisher:Steven S. Zumdahl, Susan A. Zumdahl, Donald J. DeCoste
Chapter1: Chemical Foundations
Section: Chapter Questions
Problem 1RQ: Define and explain the differences between the following terms. a. law and theory b. theory and...
Related questions
Question
100%

Transcribed Image Text:**Laboratory Report**
**The Density of Reference Solutions**
**Mass of empty beaker: 100.750 g**
| Solution | Mass of the solution and beaker, g | Mass of solution, g | Sample Volume, mL | Density, g/mL |
|----------|------------------------------------|---------------------|-------------------|---------------|
| 0% Sugar | 110.753 g | | 10.00 mL | |
| 5% Sugar | 111.015 g | | 10.00 mL | |
| 10% Sugar| 111.245 g | | 10.00 mL | |
| 15% Sugar| 111.515 g | | 10.00 mL | |
| 20% Sugar| 111.756 g | | 10.00 mL | |
**Beverage Densities**
| Beverage | Mass of the solution and beaker, g | Mass of solution, g | Sample Volume, mL | Density, g/mL |
|----------|------------------------------------|---------------------|-------------------|---------------|
| Coke | 111.710 g | | 10.00 mL | |
| Sprite | 111.405 g | | 10.00 mL | |
**Calculations:**
To calculate the mass of the solution, subtract the mass of the empty beaker from the mass of the solution and beaker. For calculating the density, divide the mass of the solution by the sample volume.
This table presents the data collected for the analysis of solution densities, including different sugar concentrations (0%, 5%, 10%, 15%, and 20%) as well as beverages (Coke and Sprite). The table details the total mass of the solution and beaker, with an empty beaker mass of 100.750 g used as a reference. The sample volume for each solution is consistently 10.00 mL. Density calculations are to be completed using the recorded masses.
Expert Solution
Step 1
Density is defined as mass per unit volume.
In this case, the mass of the sample (of volume 10 mL) can be determined by dividing the mass of the sample (obtained by subtracting the mass of the empty beaker from the combined mass of the solution and beaker) with the colume.
The calculation table is as follows.

Step by step
Solved in 2 steps with 2 images

Follow-up Questions
Read through expert solutions to related follow-up questions below.
Follow-up Question

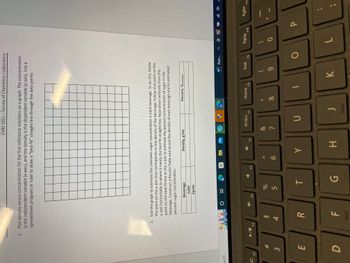
Transcribed Image Text:arch
F2
#
3
E
D
1. Plot density versus concentration for the five reference solutions on a graph. The concentration
is the independent variable (x-axis), and the density is the dependent variable (y-axis). Use a
spreadsheet program or ruler to draw a "best-fit" straight line through the data points.
II
2. Use the graph to estimate the unknown sugar concentration in each beverage. To do this, locate
the point on the y-axis that corresponds to the density of the beverage. Follow that point on the
y-axis horizontally to where it meets the best-fit straight line. Read down vertically from this
point on the best-fit line to the x-axis to estimate the percent concentration of sugar in the
beverage. Construct a Results Table and record the density of each beverage and its estimated
percent sugar concentration.
F3
LA
$
4
R
LL
Beverage
Coke
Sprite
O E
F4
%
5
T
G
F5
7
^
6
Density, g/mL
(
CHM 101L-Survey of Chemistry | Laboratory
Y
F6
H
S
PrtScn
&
7
U
F7
Percent, %estimated
Home
8
F8
9
JK
Rain...
End
F9
O
(8)
PgUp
0
L
F10
P
(641)
PgDn
F11
Solution
Knowledge Booster
Learn more about
Need a deep-dive on the concept behind this application? Look no further. Learn more about this topic, chemistry and related others by exploring similar questions and additional content below.Recommended textbooks for you

Chemistry
Chemistry
ISBN:
9781305957404
Author:
Steven S. Zumdahl, Susan A. Zumdahl, Donald J. DeCoste
Publisher:
Cengage Learning

Chemistry
Chemistry
ISBN:
9781259911156
Author:
Raymond Chang Dr., Jason Overby Professor
Publisher:
McGraw-Hill Education

Principles of Instrumental Analysis
Chemistry
ISBN:
9781305577213
Author:
Douglas A. Skoog, F. James Holler, Stanley R. Crouch
Publisher:
Cengage Learning

Chemistry
Chemistry
ISBN:
9781305957404
Author:
Steven S. Zumdahl, Susan A. Zumdahl, Donald J. DeCoste
Publisher:
Cengage Learning

Chemistry
Chemistry
ISBN:
9781259911156
Author:
Raymond Chang Dr., Jason Overby Professor
Publisher:
McGraw-Hill Education

Principles of Instrumental Analysis
Chemistry
ISBN:
9781305577213
Author:
Douglas A. Skoog, F. James Holler, Stanley R. Crouch
Publisher:
Cengage Learning

Organic Chemistry
Chemistry
ISBN:
9780078021558
Author:
Janice Gorzynski Smith Dr.
Publisher:
McGraw-Hill Education

Chemistry: Principles and Reactions
Chemistry
ISBN:
9781305079373
Author:
William L. Masterton, Cecile N. Hurley
Publisher:
Cengage Learning

Elementary Principles of Chemical Processes, Bind…
Chemistry
ISBN:
9781118431221
Author:
Richard M. Felder, Ronald W. Rousseau, Lisa G. Bullard
Publisher:
WILEY