The data shown below consists of the price (in dollars) of 7 events at a local venue and the number of people who attended. Determine if there is significant linear correlation between ticket price and number of attendees. Use a significance level of 0.05 and round all values to 4 decimal places. Ticket Price Attendence 6 192 10 138 14 156 18 159 22 136 26 113 30 92 34 104 Ho: ρ = 0 Ha: ρ ≠ 0 Find the Linear Correlation Coefficient r = Find the p-value p-value =


Correlation
Correlation defines a relationship between two independent variables. It tells the degree to which variables move in relation to each other. When two sets of data are related to each other, there is a correlation between them.
Linear Correlation
A correlation is used to determine the relationships between numerical and categorical variables. In other words, it is an indicator of how things are connected to one another. The correlation analysis is the study of how variables are related.
Regression Analysis
Regression analysis is a statistical method in which it estimates the relationship between a dependent variable and one or more independent variable. In simple terms dependent variable is called as outcome variable and independent variable is called as predictors. Regression analysis is one of the methods to find the trends in data. The independent variable used in Regression analysis is named Predictor variable. It offers data of an associated dependent variable regarding a particular outcome.
The data shown below consists of the price (in dollars) of 7
| Ticket Price | Attendence |
|---|---|
| 6 | 192 |
| 10 | 138 |
| 14 | 156 |
| 18 | 159 |
| 22 | 136 |
| 26 | 113 |
| 30 | 92 |
| 34 | 104 |
Ho: ρ = 0
Ha: ρ ≠ 0
Find the Linear
r =
Find the p-value
p-value =
Definition: Correlation
The correlation coefficient, r, tells us about the strength and direction of the linear relationship between x and y. However, the reliability of the linear model also depends on how many observed data points are in the sample. We need to look at both the value of the correlation coefficient r and the sample size n, together.
Performing the Hypothesis Test
- Null Hypothesis: H0: ρ = 0
- Alternate Hypothesis: Ha: ρ ≠ 0
What the Hypotheses Mean in Words
- Null Hypothesis H0: The population correlation coefficient IS NOT significantly different from zero. There IS NOT a significant linear relationship(correlation) between x and y in the population.
- Alternate Hypothesis Ha: The population correlation coefficient IS significantly DIFFERENT FROM zero. There IS A SIGNIFICANT LINEAR RELATIONSHIP (correlation) between x and y in the population.
Calculation Part:
i)Correlation:
| Ticket Price(X) | Attendence(Y) | (Xi-Xbar) | (Yi-Ybar) | (Xi-Xbar)^2 | (Yi-Ybar)^2 | (Xi-Xbar)*(Yi-Ybar) |
| 6 | 192 | -14 | 55.75 | 196 | 3108.0625 | -780.5 |
| 10 | 138 | -10 | 1.75 | 100 | 3.0625 | -17.5 |
| 14 | 156 | -6 | 19.75 | 36 | 390.0625 | -118.5 |
| 18 | 159 | -2 | 22.75 | 4 | 517.5625 | -45.5 |
| 22 | 136 | 2 | -0.25 | 4 | 0.0625 | -0.5 |
| 26 | 113 | 6 | -23.25 | 36 | 540.5625 | -139.5 |
| 30 | 92 | 10 | -44.25 | 100 | 1958.0625 | -442.5 |
| 34 | 104 | 14 | -32.25 | 196 | 1040.0625 | -451.5 |
| X-bar=20 | Y-bar=136.25 | ∑(Xi-Xbar)^2=672 | ∑(Yi-Ybar)^2=7557.5 | ∑(Xi-Xbar)*(Yi-Ybar)=-1996 |
to find correlation coefficient using below formula:
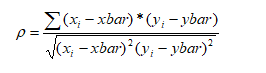
interpret the above table results in correlation coefficient formula
ρ=(-1996)/sqrt(672*7557.5)
ρ=(-1996)/sqrt(5078640)
ρ=(-1996)/(2253.5838)
ρ=-0.8857
ii)P- value:
to find P- value using ρ and degrees of freedom
P=0.003(refer t tables)
P=0.003

Step by step
Solved in 3 steps with 1 images


