The data set provides measurements of 5 different samples. Answer the following questions if you were to create an xbar control chart, suppose the population standard deviation is unknown. For your convenience, the control chart constant table is provided control chart data set provided 1. What is the centerline, rounded to two decimal places? 2. What is the UCL, rounded to two decimal places? 3. What is the LCL, rounded to two decimal places?


The data set provides measurements of 5 different samples. Answer the following questions if you were to create an xbar control chart, suppose the population standard deviation is unknown.
For your convenience, the control chart constant table is provided
control chart data set provided
1. What is the centerline, rounded to two decimal places?
2. What is the UCL, rounded to two decimal places?
3. What is the LCL, rounded to two decimal places?
|
Table of constants for Xbar and R control charts |
|||||
|
|
Charts for Averages |
Charts for |
|||
|
|
Control Limits Factor |
Divisors to Estimate σx |
Factors for Control Limits |
||
|
|
A2 |
d2 |
D3 |
D4 |
|
|
2 |
1.88 |
1.128 |
- |
3.267 |
|
|
3 |
1.023 |
1.693 |
- |
2.574 |
|
|
4 |
0.729 |
2.059 |
- |
2.282 |
|
|
5 |
0.577 |
2.326 |
- |
2.114 |
|
|
6 |
0.483 |
2.534 |
- |
2.004 |
|
|
7 |
0.419 |
2.704 |
0.076 |
1.924 |
|
|
8 |
0.373 |
2.847 |
0.136 |
1.864 |
|
|
9 |
0.337 |
2.97 |
0.184 |
1.816 |
|
|
10 |
0.308 |
3.078 |
0.223 |
1.777 |
|
|
15 |
0.223 |
3.472 |
0.347 |
1.653 |
|
|
25 |
0.153 |
3.931 |
0.459 |
1.541 |
|
Control chart question data set |
||||
|
sample |
measurements |
|||
|
1 |
50.5 |
51.2 |
49.8 |
50.2 |
|
2 |
47.8 |
48.9 |
50 |
50.2 |
|
3 |
48.9 |
50.9 |
51.3 |
49.7 |
|
4 |
47.7 |
48.1 |
49 |
49.9 |
|
5 |
49.7 |
50 |
51.4 |
53.2 |
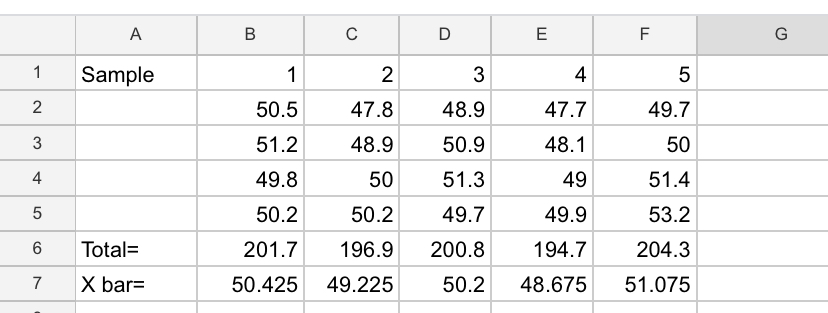
From the given data set we find the value of X bar for every sample:
X bar=ΣXi/k
Range of Sample 1= Max-Min
= 51.2-49.8
R1= 1.4
Similarly,
R2= 2.4
R3= 2.4
R4= 2.2
R5= 3.5

Step by step
Solved in 3 steps with 1 images


