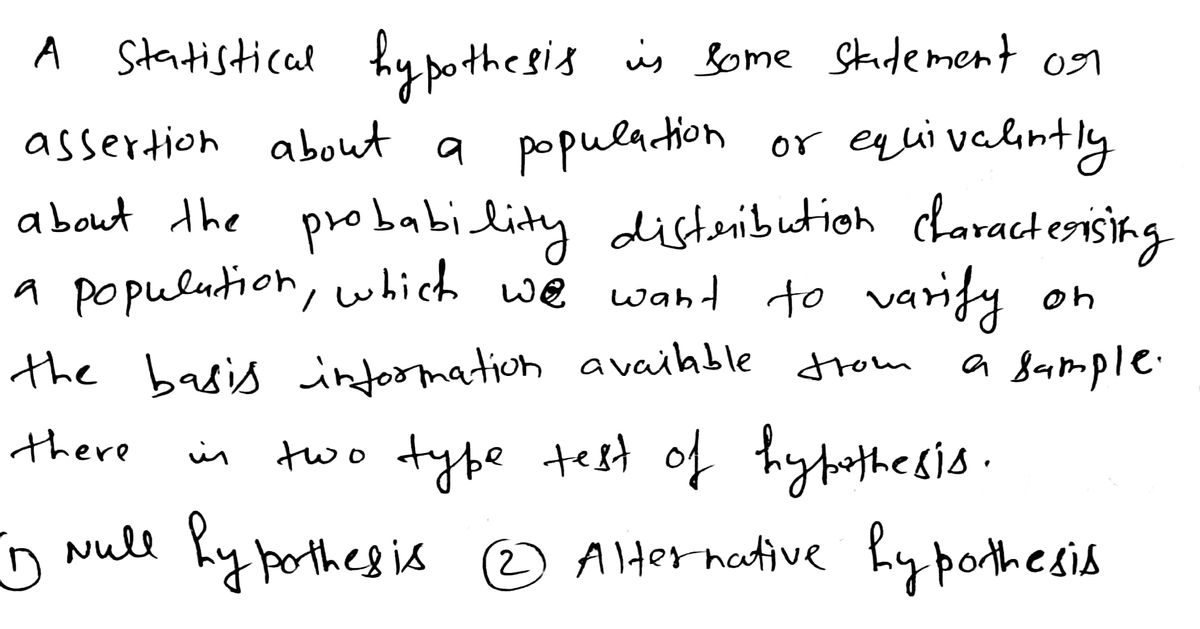
The data collected in a research study well either support or refute the -that the study is designed to tes OA. Analysis OB. Hypothesis OC. Operational definition OD. Statistics
Q: While it is known from data on national sales that 25% of cars sold are sedans, a survey in one city…
A: We define the parameter and statistics as : The parameters are the summaries of the data for the…
Q: In making an experimental test plan, data analysis, presentation and visualization falls into A.…
A: The correct option is b. Data reduction.
Q: Sloane conducted a study on years of completed education and income at age 40. She found that for…
A: In the given case, the researcher obtained the income of a sample of 40 years olds and their…
Q: 4. Refer to Table 6 and answer parts a-d below. a. Write out each of the bivariable associations…
A:
Q: The following SPSS output were taken from the study of life satisfaction of individuals in Taman Sri…
A: The following conclusions can be drawn from the SPSS Data provided A linear regression model is…
Q: 11. A recent study of smoking cessation programs collected information about nicotine replacement…
A: Here we will use given Venn diagram to answer the following
Q: P1-P2 12 200 200 0.025 0.021233817 -0.029694689 0.079694689 According to the output, what is the…
A: From the output, lower limit is -0.03.
Q: A food service director for a national corporation suspects that people are more likely to order…
A: a) Null Hypothesis: H0: The salad sales are not uniformly distributed across the days of the week.…
Q: 109. Suppose a study was done to replicate the results of the 2003 study by Wansink et al. in…
A: Anova is the measure of a parametric test. It is used to compare the average significance of three…
Q: 13.76 The data on air pollution are from Sokal and Rohlf (1981), Biometry. The following data are on…
A: Variables: y=Annual mean concentration of sulfur dioxide x1=Average annual temperature x2=number of…
Q: disorders seen on television. For the following data, students are classified into three categories…
A: The following information has been provided: Little or none Moderate Substantial 4 7 10…
Q: Ackerman and Goldsmith (2011) compared learning performance for students who studied the same…
A: Given Information : In 2011 , Ackerman and Goldsmith compared learning performance for students who…
Q: A researcher was interested in finding out whether students’ sense of belonging in a course differed…
A: Given that: Campus Zoom 3 7 2 5 7 4 1 8 6 9
Q: A sociologist was interested in estimating some aspects of family life in a town. Information about…
A: The elements of the population is the number of families in town. The population size is,
Q: Consider the following situation: Doctors recommend having a total cholesterol level below 200…
A: Doctors recommend having a total cholesterol level below 200 mg/dl. A large local company wants to…
Q: cant interaction. Use a = .05. Factor A is method of loading and unloading; Factor B is the type of…
A: It is required to complete the ANOVA table, find the p-value for Factor A, and test for significant…
Q: This was a question on my homework and I would like to know if I answered it correctly. Thank you…
A: Odds (O):The “odds” of the occurrence of an event is the ratio of the number of occurrences of the…
Q: An experiment was conducted in order to determine if cerebral blood flow in human beings can be…
A: We need to fit the given dataset into a quadratic equation of the form: y=a+bx+cx2 and then…
Q: Question 3 (7 parts): 'Purchase intention' is an important metric for new products. When a new…
A: Instruction : Please answer e, f, and g. For sample 1 : Sample size , n1 = 500 Number of people…
Q: Prehistoric pottery vessels are usually found as sherds (broken pieces) and are carefully…
A: It is given that x be the body diameter in centimeters and y be the height in centimeters of…
Q: Which model is the better predictor based on the
A: From the previous question,The MSE value for moving average method is 1.2346.The MSE value for…
Q: A respondent of a survey is asked whether their most recent dining experience was excellent, good,…
A: Hi! Thank you for the question, As per the honor code, we are allowed to answer one question at a…
Q: The article “Well-Fed Crickets Bowl Maidens Over” (Nature Science Update, February 11, 1999)…
A: Given data : sample size, n = 26 sample mean, x̄ = 64.04 sample standard…
Q: Select the type of study and the type of conclusions that can be drawn based on the type of study…
A: The objective is to best interpret the type of study and the type of conclusion that can be inferred…
Q: For the 2001–2002 National Basketball Association season, Philadelphia 76ers Allen Iverson was the…
A:
Q: Tecrübe (Yıl) Hata Sayısı 18 3 5 7 14 5 3 - 9 4 11 5 9. 2 11 3 9 O A) 0,7 O B) 0,3 C) 0,4 O D) 0,5 O…
A:
Q: 1. What is a Q-test used for/what does it compare? 2. What is a F-test used for/what does it…
A: Since you have asked multiple questions, we will solve the first question for you. If you want any…
Q: If appropriate, determine the proper conclusion at the 0.05 significance level. Choose the correct…
A: Given information: Right Handed Left handed Female 858 871 878 858 876 885 786 846…
Q: lected the following measurements. peed (km/h) 30 40 50 60 70 80 90 ing Distance (m) 19.2 22.2 24.8…
A: Linear regression is a linear approach to model the relationship between a dependent variable and…
Q: particular method of analysis in a research study depends on: A. Research question B. Study design…
A: Question is : In a research study, any particular method depends on.
Q: A glass manufacturing company wanted to investigate the effect of breakoff pressure and stopper…
A: Given the results of the effect of breakoff pressure and stopper height on the percentage of…
Q: Prehistoric pottery vessels are usually found as sherds (broken pieces) and are carefully…
A: (a) Determine the value of the standard error. The value of the standard error form the given…
Q: A paper described a study that examined whether stress accelerates aging at a cellular level. The…
A: Regression Equation: When we want to predict the value of one variable, say y, from the given value…
Q: General Direction: Perform each of the following steps. a. Find the Spearman rank correlation…
A: Given data: Grade 4 89 84 90 89 88 77 80 Grade 8 81 75 66 76 80 59 74 The objective is to…
Q: One of the following not effected by extreme values
A: Note : According to our guidelines we are solving only first question and the rest question may be…
Q: Let uss. HMs HLs Hsuv and HMy represent the mean costs per mile for small sedans, medium sedans,…
A: Null and alternative hypotheses: The hypothesis which is tentatively fixed up under and tested for…
Q: Read through this scenario and look at the data that was collected. State the null and all possible…
A: Provided ANOVA result with replication
Q: (Use SPSS) A random sample of nine male race horses at a Fauquier County stable yielded the…
A: b)Simple Linear Regression: The equation of the estimated regression line is: 𝑦^=60.9239+1.4698𝑥…
Q: A paper described a study that examined whether stress accelerates aging at a cellular level. The…
A: a) Step-by-step procedure to find the regression line using Excel: In Excel sheet, enter x and y in…
Q: In an ABA design, the second stage is used to: reduce the chance that fatigue effects will occur…
A: In an ABA design, the second stage is used to: Explanation: It involves measuring the dependent…
Q: It can be said that some professions/jobs come with more stress. This stress is sometimes carried…
A: The data are given, for the Pearson's coefficient of skewness first we calculate mean, standard…
Q: datasets, shown in Figures 3 and 4 below. 2 1- 270 275 280 285 290 295 300 305 310 315 Figure 3
A: From the given data set, firstly make a frequency table and then make a histogram with the help of…
Q: Is the proportion of wildfires caused by humans in the south lower than the proportion of wildfires…
A: c. Denote p1, p2 as the true population proportions of wildfires caused by human in south and…
Q: labor time for the plant- ing of a medium-sized tree. Actual times from a sample of 10 plantings…
A:
Q: Prehistoric pottery vessels are usually found as sherds (broken pieces) and are carefully…
A: Given information Predictor Coef SE Coef T P Constant -0.212 2.429 -0.09…
Step by step
Solved in 2 steps with 1 images
- A high school teacher at a small private school assigns trigonometry practice problems to be worked on via the net. Students must use a password to access the problems, and the time of log-in and log-off is automatically recorded for the teacher. At the end of the week, the teacher examines the amount of time each student spent working on the assigned problems. The data is provided below in minutes. Determine Mean, Median and Mode. 15 28 25 48 22 43 49 34 22 33 27 25 22 20 39A special education teacher did research on whether or not there is a relationship between the number of students in his class and the number incidents of “acting out” behaviors exhibited by the autistic students in the classroom. He collects data for a year and aggregates them by month. He obtained the statistics below, r= -.863 R2=.74 b= -1.212294 a= 131.176598 10.) How does the presence of more students affect the incidents in the class? a) as students are added the incidences increase b) as students are added the incidences decrease c) the number of students does not affect acting out d) the number of students caused more incidents How much of the variability of acting out is explained by the number of students in the class?___________Consider the following data for this question B1 B2 A1 M = 10 M = 20 A2 M = 30 M = ? The above data, what value for the missing mean would result in no interaction between A and B? Select one: a. 20 b. 30 c. 10 d. 40
- A high school teacher at a small private school assigns trigonometry practice problems to be worked on via the net. Students must use a password to access the problems, and the time of log-in and log-off is automatically recorded for the teacher. At the end of the week, the teacher examines the amount of time each student spent working on the assigned problems. The data is provided below in minutes. Determine Mean, Median and Mode. 15 28 25 48 22 43 49 34 22 33 27 25 22 20 39Consider the following scenario and answer the questions below: The ornithologist decided to investigate the effect of temperature on the migration of North American birds. Develop a hypothesis in the appropriate format. Identify the independent variable. Identify the dependent variable. Plan an investigation (what would she do to collect data?). Did she engage in basic science or applied science? Explain. Did she engage in inductive or deductive reasoning? Explain1. Which of the following is an unbiased point estimator of a population proportion? A. p-value B. ?C. ?0D. ?̅
- A researcher was interested in finding out whether students’ sense of belonging in a course differed between students attending classes on campus and students attending classes on Zoom. They recruited five students attending classes on campus and five students attending classes on Zoom to test this. Students were asked to complete a survey measuring how much they felt like they belonged in the course. The scale ranged from 0 (not at all) to 10 (very much). Students’ data, which were non-normal, are provided below. Campus Zoom 3 7 2 5 7 4 1 8 6 9 What is your obtained statistic?A) 19.5B) 35.5C) 3D) 10 What is your critical statistic?A) 17B) 19C) 0D) 1 What is your conclusion?A) Students taking the course on campus reported a significantly lower sense of belonging compared to students taking the course on Zoom.B) Students taking the course on campus reported a significantly higher sense of belonging compared to students taking the course on Zoom.C) Sense of belonging…1. Using the following data: 5568 8 9 10 10 12 15 16 19 20 20 21 24 25 25 30 32 Quartile 1 = Quartile 2 = Quartile 3 =This requires manual calculation as well as analyzing data using the statistical package R. The detailed rubric for this may be located in the guide as well as the document. You will be working with the KBP dataset provided in the course space. You will also need to use the document, Questions for KBP Survey. This document has selected questions as they appeared on the questionnaire that was administered to collect the data for this project. 1. Classify the variables by the levels of measurement used. Explain your choice of the levels of measurement. 2. Using R, generate a graph to represent the sample by alcohol usage in the past 4 weeks. What can you say about alcohol usage among this sample of young persons? 3. Using R, calculate the proportion of individuals by relationship status and report in a relative frequency distribution table. Respondents # Age of Respondent Sex of Respondents Relationship Status Age at first Sexual Encounter Practice Religion number of persons use…
- Data Table Type A 7.3 7.6 7.1 7.1 7.1 7.9 6.4. 6.9 7.5 7.2 Type B 8.7 8.2 8.3 7.7 8.8 8.2 8.7 7.1 Type С 8.5 8.3 9.3 9.2 9.3 9.5 8.8 8.7 8.5 - XWhich of the following is not equivalent to the other three? Choose the correct answer below. O Dependent variable Independent variable 000 O Predictor variable O Explanatory variableHere are the world record race times for women in the 10,000-meter run over several years. a) Which is the explanatory variable and which is the response variable? Year Race Time (seconds) 1967 2286.4 b) Make a scatterplot of these data. You do not have to draw the scatterplot for me. Describe what you see (form, direction, 1970 2130.5 1975 2100.4 strength, outliers). 1975 2041.4 c) Write the equation of the regression line for predicting race time from year. 1977 1995.1 1979 1972.5 d) Give the meaning of the slope of your line in terms of race time and year. What are the units of the slope in this problem? 1981 1950.8 1981 1937.2 e) What percent of the observed variation in 1982 1895.3 the race times can be explained by your 1983 1895.0 model? 1983 1887.6 f) Find the residual for the first data point or 1984 1873.8 the list (the 2286.4 seconds from 1967). 1985 1859.4 g) What does this linear model predict for th race time in the year 2075? Do you think 1986 1813.7 this is reasonable?…