The Congressional Budget Office reports that 36% of federal civilian employees have a bachelor's degree or higher (The Wall Street Journal). A random sample of 115 employees in the private sector showed that 32 have a bachelor's degree or higher. Does this indicate that the percentage of employees holding bachelor's degrees or higher in the private sector is less than in the federal civilian sector? Use α = 0.05. (b) What sampling distribution will you use? What assumptions are you making? The standard normal, since np < 5 and nq < 5. The Student's t, since np > 5 and nq > 5. (inccorect) The Student's t, since np < 5 and nq < 5. (incorrect) The standard normal, since np > 5 and nq > 5. What is the value of the sample test statistic? (Round your answer to two decimal places.) (-1.34, -1.35 is incorrect) (d) Based on your answers in parts (a) to (c), will you reject or fail to reject the null hypothesis? Are the data statistically significant at level α? At the α = 0.05 level, we reject the null hypothesis and conclude the data are statistically significant. At the α = 0.05 level, we fail to reject the null hypothesis and conclude the data are statistically significant. (incorrect) At the α = 0.05 level, we fail to reject the null hypothesis and conclude the data are not statistically significant. (incorrect) At the α = 0.05 level, we reject the null hypothesis and conclude the data are not statistically significant.


The Congressional Budget Office reports that 36% of federal civilian employees have a bachelor's degree or higher (The Wall Street Journal). A random sample of 115 employees in the private sector showed that 32 have a bachelor's degree or higher. Does this indicate that the percentage of employees holding bachelor's degrees or higher in the private sector is less than in the federal civilian sector? Use α = 0.05.
(b) What sampling distribution will you use? What assumptions are you making?
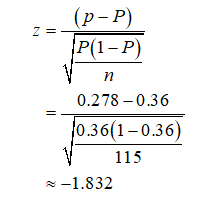
What is the value of the sample test statistic? (Round your answer to two decimal places.) (-1.34, -1.35 is incorrect)
(d) Based on your answers in parts (a) to (c), will you reject or fail to reject the null hypothesis? Are the data statistically significant at level α?
It is given that out of 115 employees, it is found that 32 have a bachelor’s degree or higher.
The sample proportion is given as
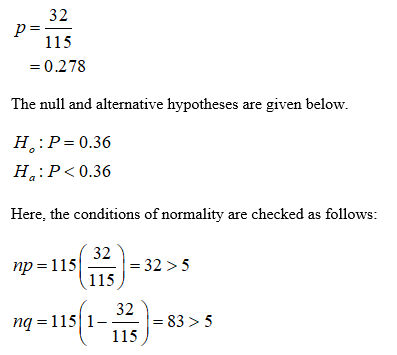
Since both the conditions are satisfied, the normal distribution can be used as the sampling distribution.
Since the alternative hypothesis has less than sign, the test is a left-tailed test.
The test statistic is given and calculated as follows.
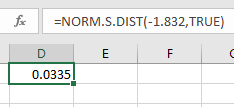
The left-tailed p-value can be obtained by the Excel formula “=NORM.S.DIST(-1.832,TRUE)”.

Trending now
This is a popular solution!

Step by step
Solved in 3 steps with 3 images


