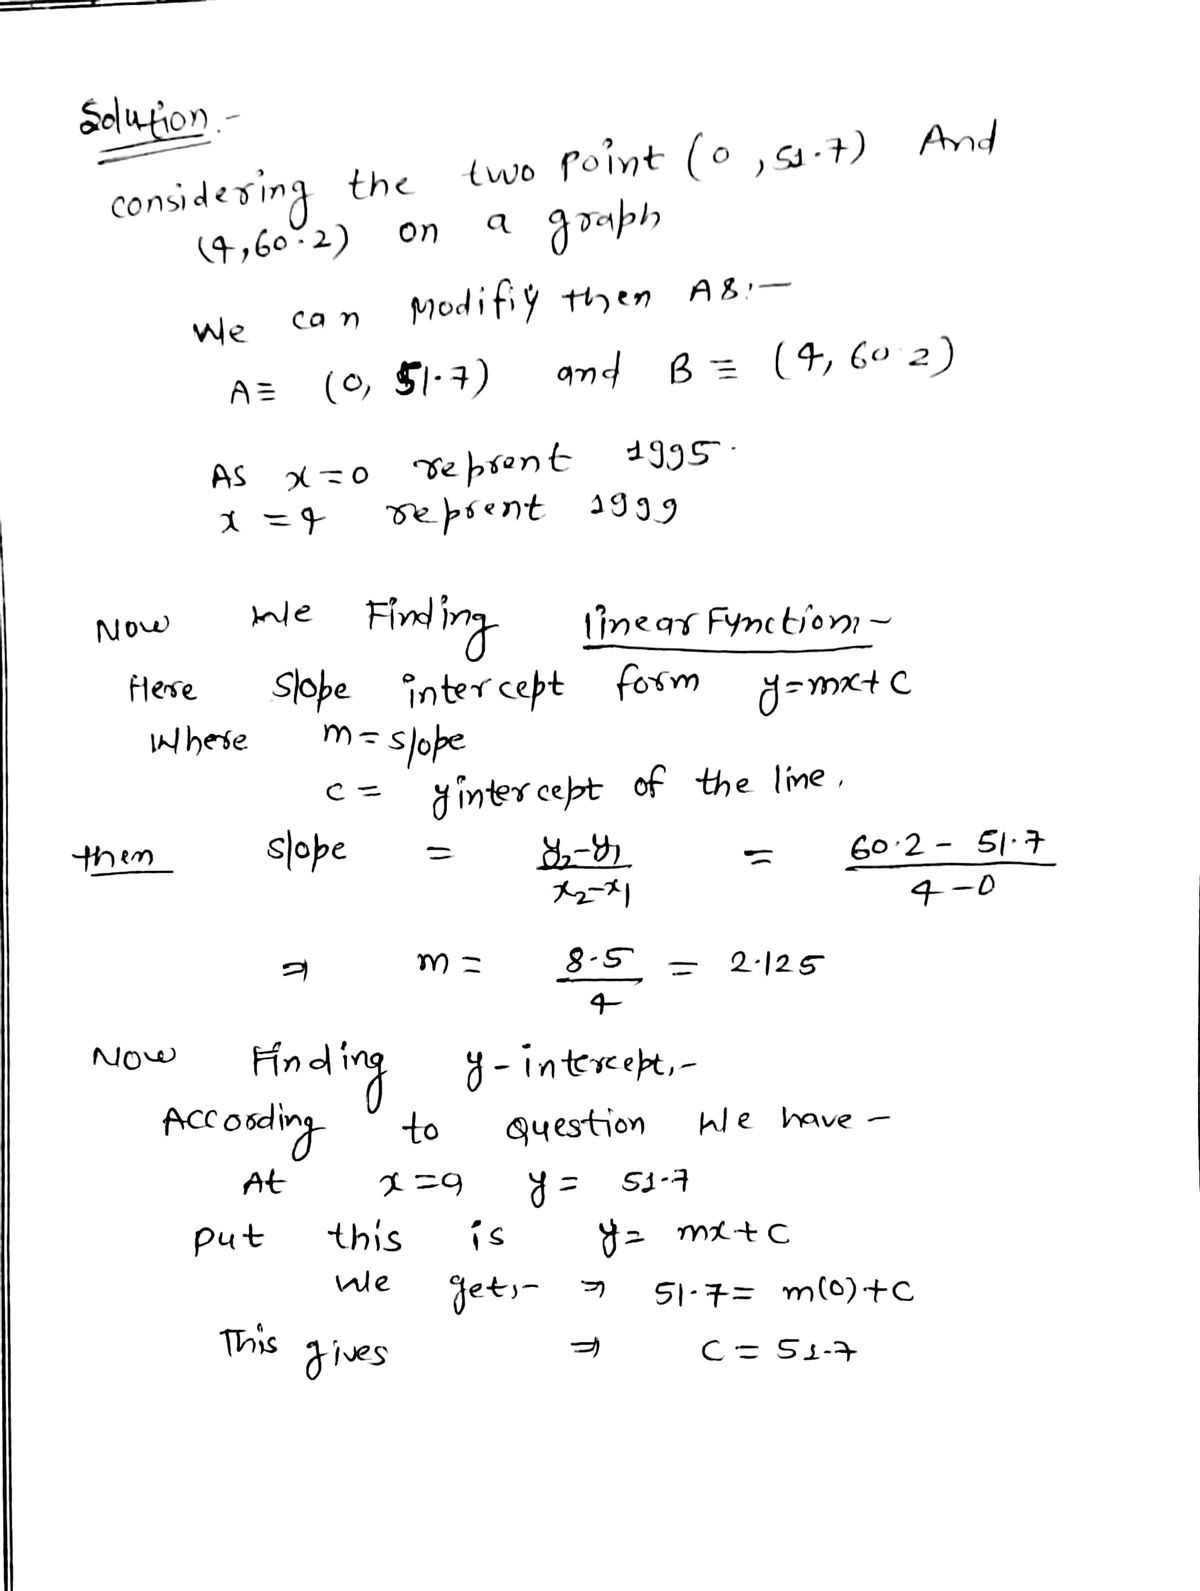
The chart to the right shows a country's annual egg production. Model the data in the chart with a linear function, using the points (0,51.7) and (4,60.2). Let x = 0 represent 1995, x = 1 represent 1996, and so on, and let y represent the egg production (in billions). Predict egg production in 2001. How does the result compare to the actual data given in the table, 69.5? Year Egg production (in billions) 51.7 52.5 54.3 57 60.2 63.8 69.5 1995 1996 1997 1998 1999 2000 2001 The linear model for the data is (Type an equation using x as the variable. Type your answer in slope-intercept form. Use integers or decimals for any numbers in the equation. Round to the nearest thousandth as needed.)
The chart to the right shows a country's annual egg production. Model the data in the chart with a linear function, using the points (0,51.7) and (4,60.2). Let x = 0 represent 1995, x = 1 represent 1996, and so on, and let y represent the egg production (in billions). Predict egg production in 2001. How does the result compare to the actual data given in the table, 69.5? Year Egg production (in billions) 51.7 52.5 54.3 57 60.2 63.8 69.5 1995 1996 1997 1998 1999 2000 2001 The linear model for the data is (Type an equation using x as the variable. Type your answer in slope-intercept form. Use integers or decimals for any numbers in the equation. Round to the nearest thousandth as needed.)

Advanced Engineering Mathematics
10th Edition
ISBN:9780470458365
Author:Erwin Kreyszig
Publisher:Erwin Kreyszig
Chapter2: Second-order Linear Odes
Section: Chapter Questions
Problem 1RQ

Related questions
Question

Transcribed Image Text:The chart to the right shows a country's annual egg production. Model the data in the chart
with a linear function, using the points (0,51.7) and (4,60.2). Let x = 0 represent 1995, x = 1
represent 1996, and so on, and let y represent the egg production (in billions). Predict egg
production in 2001. How does the result compare to the actual data given in the table, 69.5?
Year Egg production
(in billions)
51.7
52.5
54.3
57
60.2
63.8
69.5
1995
1996
1997
1998
1999
2000
2001
The linear model for the data is
(Type an equation using x as the variable. Type your answer in slope-intercept form. Use integers or decimals for any
numbers in the equation. Round to the nearest thousandth as needed.)
Expert Solution
Step 1

Trending now
This is a popular solution!

Step by step
Solved in 2 steps with 2 images

Recommended textbooks for you
Advanced Engineering Mathematics
Advanced Math
ISBN:
9780470458365
Author:
Erwin Kreyszig
Publisher:
Wiley, John & Sons, Incorporated

Numerical Methods for Engineers
Advanced Math
ISBN:
9780073397924
Author:
Steven C. Chapra Dr., Raymond P. Canale
Publisher:
McGraw-Hill Education

Introductory Mathematics for Engineering Applicat…
Advanced Math
ISBN:
9781118141809
Author:
Nathan Klingbeil
Publisher:
WILEY
Advanced Engineering Mathematics
Advanced Math
ISBN:
9780470458365
Author:
Erwin Kreyszig
Publisher:
Wiley, John & Sons, Incorporated
Numerical Methods for Engineers
Advanced Math
ISBN:
9780073397924
Author:
Steven C. Chapra Dr., Raymond P. Canale
Publisher:
McGraw-Hill Education
Introductory Mathematics for Engineering Applicat…
Advanced Math
ISBN:
9781118141809
Author:
Nathan Klingbeil
Publisher:
WILEY

Mathematics For Machine Technology
Advanced Math
ISBN:
9781337798310
Author:
Peterson, John.
Publisher:
Cengage Learning,

