The calculations for a factorial experiment involving four levels of factor A, three levels of factor B, and three replications resulted in the following data: SST = 275, SSA = 24, SSB = 21, SSAB = 175. Set up the ANOVA table and test for significance using a = 0.05. Show entries to 2 decimals, if necessary. If the answer is zero, enter "0". Use unrounded intermediate values for calculation. Source of Variation Factor A Factor B Interaction Error Total Sum of Squares Degrees of Freedom Mean Square × F value × X p-value
The calculations for a factorial experiment involving four levels of factor A, three levels of factor B, and three replications resulted in the following data: SST = 275, SSA = 24, SSB = 21, SSAB = 175. Set up the ANOVA table and test for significance using a = 0.05. Show entries to 2 decimals, if necessary. If the answer is zero, enter "0". Use unrounded intermediate values for calculation. Source of Variation Factor A Factor B Interaction Error Total Sum of Squares Degrees of Freedom Mean Square × F value × X p-value
MATLAB: An Introduction with Applications
6th Edition
ISBN:9781119256830
Author:Amos Gilat
Publisher:Amos Gilat
Chapter1: Starting With Matlab
Section: Chapter Questions
Problem 1P
Related questions
Question
Please help, have no idea how to do this

Transcribed Image Text:The calculations for a factorial experiment involving four levels of factor A, three levels of factor B, and three replications resulted in the following data:
SST = 275, SSA = 24, SSB = 21, SSAB = 175. Set up the ANOVA table and test for significance using a = 0.05. Show entries to 2 decimals, if
necessary. If the answer is zero, enter "0". Use unrounded intermediate values for calculation.
Source
of Variation
Factor A
Factor B
Interaction
Error
Total
Sum
of Squares
Degrees
of Freedom
Mean
Square
***
F value
xx
p-value
X X
Expert Solution
This question has been solved!
Explore an expertly crafted, step-by-step solution for a thorough understanding of key concepts.
This is a popular solution!
Trending now
This is a popular solution!
Step by step
Solved in 6 steps with 3 images

Follow-up Questions
Read through expert solutions to related follow-up questions below.
Follow-up Question
All wrong except for the 2

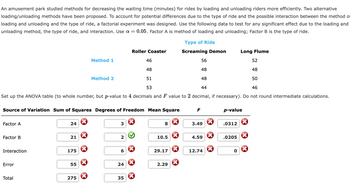
Transcribed Image Text:An amusement park studied methods for decreasing the waiting time (minutes) for rides by loading and unloading riders more efficiently. Two alternative
loading/unloading methods have been proposed. To account for potential differences due to the type of ride and the possible interaction between the method of
loading and unloading and the type of ride, a factorial experiment was designed. Use the following data to test for any significant effect due to the loading and
unloading method, the type of ride, and interaction. Use a = 0.05. Factor A is method of loading and unloading; Factor B is the type of ride.
Factor A
56
52
48
48
48
50
44
46
Set up the ANOVA table (to whole number, but p-value to 4 decimals and F value to 2 decimal, if necessary). Do not round intermediate calculations.
Factor B
Interaction
Source of Variation Sum of Squares Degrees of Freedom Mean Square
Error
Total
24
21
175
Method 1
55
275
Method 2
3
2
6
Roller Coaster
24
35
>
46
48
51
53
X
8
10.5
29.17
Type of Ride
Screaming Demon
2.29
F
3.49
4.59
12.74
p-value
.0312
Long Flume
.0205
0
Solution
Recommended textbooks for you

MATLAB: An Introduction with Applications
Statistics
ISBN:
9781119256830
Author:
Amos Gilat
Publisher:
John Wiley & Sons Inc

Probability and Statistics for Engineering and th…
Statistics
ISBN:
9781305251809
Author:
Jay L. Devore
Publisher:
Cengage Learning

Statistics for The Behavioral Sciences (MindTap C…
Statistics
ISBN:
9781305504912
Author:
Frederick J Gravetter, Larry B. Wallnau
Publisher:
Cengage Learning

MATLAB: An Introduction with Applications
Statistics
ISBN:
9781119256830
Author:
Amos Gilat
Publisher:
John Wiley & Sons Inc

Probability and Statistics for Engineering and th…
Statistics
ISBN:
9781305251809
Author:
Jay L. Devore
Publisher:
Cengage Learning

Statistics for The Behavioral Sciences (MindTap C…
Statistics
ISBN:
9781305504912
Author:
Frederick J Gravetter, Larry B. Wallnau
Publisher:
Cengage Learning

Elementary Statistics: Picturing the World (7th E…
Statistics
ISBN:
9780134683416
Author:
Ron Larson, Betsy Farber
Publisher:
PEARSON

The Basic Practice of Statistics
Statistics
ISBN:
9781319042578
Author:
David S. Moore, William I. Notz, Michael A. Fligner
Publisher:
W. H. Freeman

Introduction to the Practice of Statistics
Statistics
ISBN:
9781319013387
Author:
David S. Moore, George P. McCabe, Bruce A. Craig
Publisher:
W. H. Freeman