The board of directors is meeting to discuss quality on a particular product. The quality supervisor wants to create a chart that is easy to understand. What chart would you choose? Use n = 50 and p 0.09 to calculate the control limits and centerline. Create and interpret this chart. 12 3 4 5 6 7 8 9 10 Subgroup Number 54 3 26 18 5 Noncon- 8 2 2 forming
The board of directors is meeting to discuss quality on a particular product. The quality supervisor wants to create a chart that is easy to understand. What chart would you choose? Use n = 50 and p 0.09 to calculate the control limits and centerline. Create and interpret this chart. 12 3 4 5 6 7 8 9 10 Subgroup Number 54 3 26 18 5 Noncon- 8 2 2 forming

MATLAB: An Introduction with Applications
6th Edition
ISBN:9781119256830
Author:Amos Gilat
Publisher:Amos Gilat
Chapter1: Starting With Matlab
Section: Chapter Questions
Problem 1P

Related questions
Question
The board of directors is meeting to discuss quality on a particular product. The quality supervisor wants to create a chart that is easy to understand. What chart would you choose? Use n = 50 and p = 0.09 to calculate the control limits and centerline. Create and interpret this chart.

Transcribed Image Text:The board of directors is meeting to discuss quality on a particular product. The quality
supervisor wants to create a chart that is easy to understand. What chart would you
choose? Use n = 50 and p 0.09 to calculate the control limits and centerline. Create
and interpret this chart.
12 3 4 5 6 7 8 9 10
Subgroup
Number
54 3 26 18 5
Noncon-
8
2
2
forming
Expert Solution
Step 1
We will choose control chart to understand the quality of particular product with time to time.
Given that,
n = 50
p = 0.09
Step 2
Given data of subgroup number and nonconforming is,
Subgroup Number | 1 | 2 | 3 | 4 | 5 | 6 | 7 | 8 | 9 | 10 |
Nonconforming | 5 | 4 | 3 | 2 | 6 | 18 | 5 | 8 | 2 | 2 |
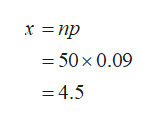
The formula to calculate mean or center line is,
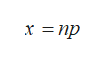
Step 3
Substitute 50 for n and 0.09 for p in the above formula, get:
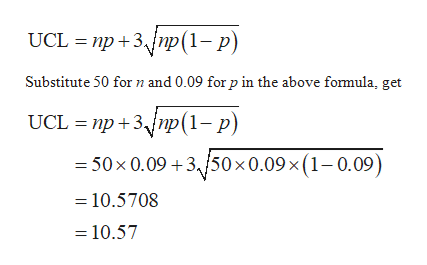
Step 4
The formula to calculate the upper control limit is,

Step by step
Solved in 8 steps with 5 images

Knowledge Booster


Learn more about
Need a deep-dive on the concept behind this application? Look no further. Learn more about this topic, statistics and related others by exploring similar questions and additional content below.Recommended textbooks for you
MATLAB: An Introduction with Applications
Statistics
ISBN:
9781119256830
Author:
Amos Gilat
Publisher:
John Wiley & Sons Inc

Probability and Statistics for Engineering and th…
Statistics
ISBN:
9781305251809
Author:
Jay L. Devore
Publisher:
Cengage Learning

Statistics for The Behavioral Sciences (MindTap C…
Statistics
ISBN:
9781305504912
Author:
Frederick J Gravetter, Larry B. Wallnau
Publisher:
Cengage Learning
MATLAB: An Introduction with Applications
Statistics
ISBN:
9781119256830
Author:
Amos Gilat
Publisher:
John Wiley & Sons Inc
Probability and Statistics for Engineering and th…
Statistics
ISBN:
9781305251809
Author:
Jay L. Devore
Publisher:
Cengage Learning
Statistics for The Behavioral Sciences (MindTap C…
Statistics
ISBN:
9781305504912
Author:
Frederick J Gravetter, Larry B. Wallnau
Publisher:
Cengage Learning

Elementary Statistics: Picturing the World (7th E…
Statistics
ISBN:
9780134683416
Author:
Ron Larson, Betsy Farber
Publisher:
PEARSON

The Basic Practice of Statistics
Statistics
ISBN:
9781319042578
Author:
David S. Moore, William I. Notz, Michael A. Fligner
Publisher:
W. H. Freeman

Introduction to the Practice of Statistics
Statistics
ISBN:
9781319013387
Author:
David S. Moore, George P. McCabe, Bruce A. Craig
Publisher:
W. H. Freeman