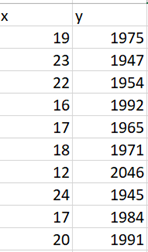
The article "Mathematical Modeling of the Argon-Oxygen Decarburization Refining Process of Stainless Steel: Part II. Application of the Model to Industrial Practice" (J. Wei and D. Zhu, Metallurgical and Materials Transactions B, 2001:212-217) presents the carbon content (in mass %) and bath temperature (in K) for 32 heats of austenitic stainless steel. These data are shown in the following table. Carbon % Temp. 1975 19 23 1947 22 1954 16 1992 17 1965 18 1971 12 2046 24 1945 17 1984 20 1991 19 1965 22 1963 18 1949 22 1960 20 1960 19 1953 18 1962 19 1985 19 1946 15 1986 20 1946 22 1950 15 1979 15 1989 17 1983 20 1966 21 1972 17 1989 18 1984 23 1967 13 1954 15 1977 a Compute the least-squares line for predicting bath temperature (y) from carbon content (x). b. Identify two outliers. Compute the two least-squares lines that result from the deletion of each outlier individually, and the least-squares line that results from the deletion of both outliers. Are the least-squares lines computed in parts (a) and (b) similar? If so, report the line that was fit to the full data set, along with 95% confidence intervals for the slope and intercept. If not, report the range of slopes, without a confidence interval.
The article "Mathematical Modeling of the Argon-Oxygen Decarburization Refining Process of Stainless Steel: Part II. Application of the Model to Industrial Practice" (J. Wei and D. Zhu, Metallurgical and Materials Transactions B, 2001:212-217) presents the carbon content (in mass %) and bath temperature (in K) for 32 heats of austenitic stainless steel. These data are shown in the following table. Carbon % Temp. 1975 19 23 1947 22 1954 16 1992 17 1965 18 1971 12 2046 24 1945 17 1984 20 1991 19 1965 22 1963 18 1949 22 1960 20 1960 19 1953 18 1962 19 1985 19 1946 15 1986 20 1946 22 1950 15 1979 15 1989 17 1983 20 1966 21 1972 17 1989 18 1984 23 1967 13 1954 15 1977 a Compute the least-squares line for predicting bath temperature (y) from carbon content (x). b. Identify two outliers. Compute the two least-squares lines that result from the deletion of each outlier individually, and the least-squares line that results from the deletion of both outliers. Are the least-squares lines computed in parts (a) and (b) similar? If so, report the line that was fit to the full data set, along with 95% confidence intervals for the slope and intercept. If not, report the range of slopes, without a confidence interval.

MATLAB: An Introduction with Applications
6th Edition
ISBN:9781119256830
Author:Amos Gilat
Publisher:Amos Gilat
Chapter1: Starting With Matlab
Section: Chapter Questions
Problem 1P

Related questions
Question

Transcribed Image Text:The article "Mathematical Modeling of the Argon-Oxygen Decarburization Refining
Process of Stainless Steel: Part II. Application of the Model to Industrial Practice" (J. Wei
and D. Zhu, Metallurgical and Materials Transactions B, 2001:212-217) presents the
carbon content (in mass %) and bath temperature (in K) for 32 heats of austenitic stainless
steel. These data are shown in the following table.
Carbon %
Temp.
1975
19
23
1947
22
1954
16
1992
17
1965
18
1971
12
2046
24
1945
17
1984
20
1991

Transcribed Image Text:19
1965
22
1963
18
1949
22
1960
20
1960
19
1953
18
1962
19
1985
19
1946
15
1986
20
1946
22
1950
15
1979
15
1989
17
1983
20
1966
21
1972
17
1989
18
1984
23
1967
13
1954
15
1977
a Compute the least-squares line for predicting bath temperature (y) from carbon content
(x).
b. Identify two outliers. Compute the two least-squares lines that result from the deletion
of each outlier individually, and the least-squares line that results from the deletion of
both outliers.
Are the least-squares lines computed in parts (a) and (b) similar? If so, report the line
that was fit to the full data set, along with 95% confidence intervals for the slope and
intercept. If not, report the range of slopes, without a confidence interval.
Expert Solution
Step 1
Given that,
Step 2
By using EXCEL,
- Enter the data
- Data>>data Analysis>>regression
- Enter the range of x and y
- Ok
Step 3
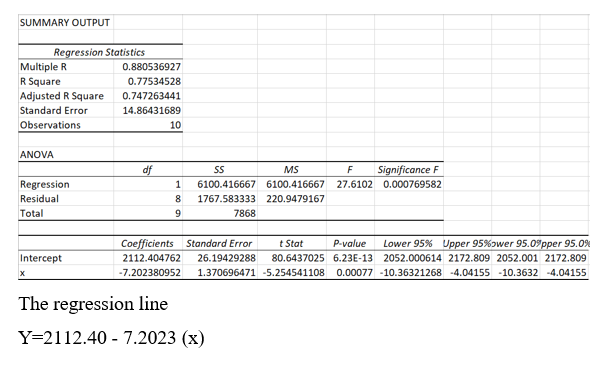
Step 4
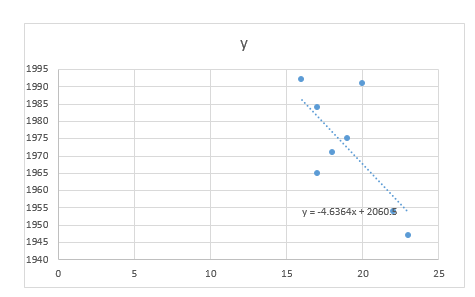

Step by step
Solved in 7 steps with 6 images

Recommended textbooks for you
MATLAB: An Introduction with Applications
Statistics
ISBN:
9781119256830
Author:
Amos Gilat
Publisher:
John Wiley & Sons Inc

Probability and Statistics for Engineering and th…
Statistics
ISBN:
9781305251809
Author:
Jay L. Devore
Publisher:
Cengage Learning

Statistics for The Behavioral Sciences (MindTap C…
Statistics
ISBN:
9781305504912
Author:
Frederick J Gravetter, Larry B. Wallnau
Publisher:
Cengage Learning
MATLAB: An Introduction with Applications
Statistics
ISBN:
9781119256830
Author:
Amos Gilat
Publisher:
John Wiley & Sons Inc
Probability and Statistics for Engineering and th…
Statistics
ISBN:
9781305251809
Author:
Jay L. Devore
Publisher:
Cengage Learning
Statistics for The Behavioral Sciences (MindTap C…
Statistics
ISBN:
9781305504912
Author:
Frederick J Gravetter, Larry B. Wallnau
Publisher:
Cengage Learning

Elementary Statistics: Picturing the World (7th E…
Statistics
ISBN:
9780134683416
Author:
Ron Larson, Betsy Farber
Publisher:
PEARSON

The Basic Practice of Statistics
Statistics
ISBN:
9781319042578
Author:
David S. Moore, William I. Notz, Michael A. Fligner
Publisher:
W. H. Freeman

Introduction to the Practice of Statistics
Statistics
ISBN:
9781319013387
Author:
David S. Moore, George P. McCabe, Bruce A. Craig
Publisher:
W. H. Freeman