The American Association of lIndividual Investors (AAII) On-Line Discount Broker Survey pols members oR Possible responses (scores) were no opinion (0), unsatisfied (1), somewhat satisfied (2), satisfied (3), and very satisfed (4). For each broker summary scores were computed by calculating a weighted average of the scores Brokerage Speed Satisfaction Scottrade, Inc. 3.4 3.5 Charles Schwab 3.3 3.4 Fidelity Brokerage Services 3.9 TD Ameritrade 3.6 3.7 ETrade Financial 3.2 2.9 Vanguard Brokerage Services 3.8 28 USAA Brokerage Services 3.8 3.6 Thinkorswim 26 26 Wels Fargo Investments 2.7 2.3 Interactive brokers 4.0 4.0 Zecco.com 2.5 2.5 (a) Developa scatter diagram for these data with the speed of execution as the independent varable 45 45 45 4.0 4.0 4.0 4.0 3.5 3.5 3.5 35 3.0 3.0 30 3.0 25 251 2.5 25 25 3.0 3.5 4.0 45 25 3.0 3.5 4.0 4.5 2.5 30 35 4.0 4.5 2.5 3.0 3.5 4.5 4.0 Speed of Execution Speed of Execution Speed of Execution Speed of Execution
The American Association of lIndividual Investors (AAII) On-Line Discount Broker Survey pols members oR Possible responses (scores) were no opinion (0), unsatisfied (1), somewhat satisfied (2), satisfied (3), and very satisfed (4). For each broker summary scores were computed by calculating a weighted average of the scores Brokerage Speed Satisfaction Scottrade, Inc. 3.4 3.5 Charles Schwab 3.3 3.4 Fidelity Brokerage Services 3.9 TD Ameritrade 3.6 3.7 ETrade Financial 3.2 2.9 Vanguard Brokerage Services 3.8 28 USAA Brokerage Services 3.8 3.6 Thinkorswim 26 26 Wels Fargo Investments 2.7 2.3 Interactive brokers 4.0 4.0 Zecco.com 2.5 2.5 (a) Developa scatter diagram for these data with the speed of execution as the independent varable 45 45 45 4.0 4.0 4.0 4.0 3.5 3.5 3.5 35 3.0 3.0 30 3.0 25 251 2.5 25 25 3.0 3.5 4.0 45 25 3.0 3.5 4.0 4.5 2.5 30 35 4.0 4.5 2.5 3.0 3.5 4.5 4.0 Speed of Execution Speed of Execution Speed of Execution Speed of Execution

MATLAB: An Introduction with Applications
6th Edition
ISBN:9781119256830
Author:Amos Gilat
Publisher:Amos Gilat
Chapter1: Starting With Matlab
Section: Chapter Questions
Problem 1P

Related questions
Question

Transcribed Image Text:webassign net/web/Student/Assignment-Responses/last?deps27985450
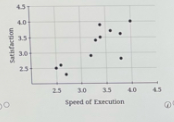
The American Association of Individual Investors (AAII) On-Line Discount Broker Survey polls members on their experiences with discount brokers. As part of the survey, members were asked to rate the quality of the speed of execution with their broker as well as provide an overall satisfaction rating for electronic trades.
Possible responses (scores) were no opinion (0), unsatisfied (1), somewhat satisfied (2), satisfied (3), and very satisfied (4). For each broker summary scores were computed by calculating a weighted average of the scores provided by each respondent. A portion of the survey results follow.t
++ c
Brokerage
Speed Satisfaction
Scottrade, Inc.
3.4
3.5
Charles Schwab
3.3
3.4
Fidelity Brokerage Services
3.9
3.4
TD Ameritrade
3.6
3.7
E*Trade Financial
3.2
2.9
Vanguard Brokerage Services
3.8
2.8
USAA Brokerage Services
3.8
3.6
Thinkorswim
2.6
2.6
Wells Fargo Investments
2.7
2.3
Interactive Brokers
4.0
4.0
Zecco.com
2.5
2.5
(a) Develop a scatter diagram for these data with the speed of execution as the independent variable
4.5
45
4.5
45
4.0
4.0
4.0
4.0
3.5-
3.5-
3.5
3.5
SE
3.0
3.0
3.0
3.0
25
25
2.5
2.5
2.5
3.0
35
4.0
4.5
25
3.0
3.5
4.0
4.5
25
3.0
3.5
4.0
4.5
25
3.0
3.5
4.0
4.5
5
Speed of Execution
Spred of Execution
Speed of Execution
Speed of Execution
(b) What does the scatter diagram developed in part (a) indicate about the relationship between the two variables?
O The scatter diagram indicates a positive linear relationship between speed of execution rating and overal satisfaction rating for electronic trades.
ween speed of eecution rating and overall satisfaction rating for electronic trades.
O The scatter diagram indicates no noticeable linear relationship
bet
O The scatter dagram indicates a negative inear relationship between speed of execution rating and overal satisfaction rating for electronic trades.
(c) Develop the least squares estimated regression equation. (Round vour numerical values to three decimal places.)
(d) Provide an interpretation for the slepe of the estimated regression equation
O The slope gives the change in the speed of execution rating for every one point increase in the overall satisfaction rating.
O The slope gives the change in the speed of execution rating for every one point decrease in the overal satisfaction rating.
O The slope gives the overall satisfaction rating when the speed of execution rating is 0.
O The slope gives the change in the overall satistaction rating for every one point increase in the speed of execution rating
whon the oaralca
Expert Solution
Step 1
(a) Procedure to obtain scatterplot using Excel:
- Enter the data in an excel sheet.
- Select the data and Go to Insert.
- Choose Scatter under Charts.
Answer:

Step by step
Solved in 4 steps with 2 images

Recommended textbooks for you
MATLAB: An Introduction with Applications
Statistics
ISBN:
9781119256830
Author:
Amos Gilat
Publisher:
John Wiley & Sons Inc

Probability and Statistics for Engineering and th…
Statistics
ISBN:
9781305251809
Author:
Jay L. Devore
Publisher:
Cengage Learning

Statistics for The Behavioral Sciences (MindTap C…
Statistics
ISBN:
9781305504912
Author:
Frederick J Gravetter, Larry B. Wallnau
Publisher:
Cengage Learning
MATLAB: An Introduction with Applications
Statistics
ISBN:
9781119256830
Author:
Amos Gilat
Publisher:
John Wiley & Sons Inc
Probability and Statistics for Engineering and th…
Statistics
ISBN:
9781305251809
Author:
Jay L. Devore
Publisher:
Cengage Learning
Statistics for The Behavioral Sciences (MindTap C…
Statistics
ISBN:
9781305504912
Author:
Frederick J Gravetter, Larry B. Wallnau
Publisher:
Cengage Learning

Elementary Statistics: Picturing the World (7th E…
Statistics
ISBN:
9780134683416
Author:
Ron Larson, Betsy Farber
Publisher:
PEARSON

The Basic Practice of Statistics
Statistics
ISBN:
9781319042578
Author:
David S. Moore, William I. Notz, Michael A. Fligner
Publisher:
W. H. Freeman

Introduction to the Practice of Statistics
Statistics
ISBN:
9781319013387
Author:
David S. Moore, George P. McCabe, Bruce A. Craig
Publisher:
W. H. Freeman