The accompanying table describes results from groups of 10 births from 10 different sets of parents. The random variable x represents the number of girls among 10 children. Use the range rule of thumb a significantly low number of girls. E Click the icon to view the table. determine whether 1 girl in 10 births is Use the range rule of thumb to identify a range of values that are not significant. The maximum value in this range is 5.1 girls. (Round to one decimal place as needed.) The minimum value in this range is 1.7 girls. (Round to one decimal place as needed.) Based on the result, is 1 girl in 10 births a significantly low number of girls? Explain. O A. Yes, 1 girl is a significantly low number of girls, because 1 girl is below the range of values that are not significant. in uith thot ore pnt eignifieont Feontly low puaher of eide hoeouee 4


Contingency Table
A contingency table can be defined as the visual representation of the relationship between two or more categorical variables that can be evaluated and registered. It is a categorical version of the scatterplot, which is used to investigate the linear relationship between two variables. A contingency table is indeed a type of frequency distribution table that displays two variables at the same time.
Binomial Distribution
Binomial is an algebraic expression of the sum or the difference of two terms. Before knowing about binomial distribution, we must know about the binomial theorem.
5


Given Information:
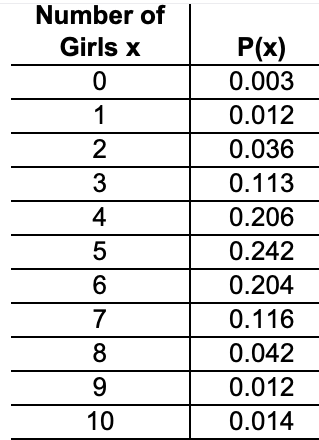
Using the range rule of thumb we are asked to determine the range of values that are not significant:
Using the above probability distribution table, find the mean and standard deviation as follows:
Mean/ Expected value:
Standard deviation is calculated using the formula:
Substitute the values in the above formula:

Trending now
This is a popular solution!

Learn your way
Includes step-by-step video

Step by step
Solved in 2 steps with 1 images


