A data set includes 103 body temperatures of healthy adult humans having a mean of 98.9°F and a standard deviation of 0.65°F. Construct a 99% confidence interval estimate of the mean body temperature of all healthy humans. What does the sample suggest about the use of 98.6°F as the mean body temperature? Click here to view at distribution table. Click here to view page 1 of the standard normal distribution table. Click here to view page 2 of the standard normal distribution table. What is the confidence interval estimate of the population mean µ? K8 AC °F<µ< 8. °F (Round to three decimal places as needed.)
A data set includes 103 body temperatures of healthy adult humans having a mean of 98.9°F and a standard deviation of 0.65°F. Construct a 99% confidence interval estimate of the mean body temperature of all healthy humans. What does the sample suggest about the use of 98.6°F as the mean body temperature? Click here to view at distribution table. Click here to view page 1 of the standard normal distribution table. Click here to view page 2 of the standard normal distribution table. What is the confidence interval estimate of the population mean µ? K8 AC °F<µ< 8. °F (Round to three decimal places as needed.)
MATLAB: An Introduction with Applications
6th Edition
ISBN:9781119256830
Author:Amos Gilat
Publisher:Amos Gilat
Chapter1: Starting With Matlab
Section: Chapter Questions
Problem 1P
Related questions
Question

Transcribed Image Text:A data set includes 103 body temperatures of healthy adult humans having a mean of 98.9°F and a standard deviation of
0.65°F. Construct a 99% confidence interval estimate of the mean body temperature of all healthy humans. What does the
sample suggest about the use of 98.6°F as the mean body temperature?
Click here to view at distribution table.
Click here to view page 1 of the standard normal distribution table.
Click here to view page 2 of the standard normal distribution table.
What is the confidence interval estimate of the population mean µ?
K8 AC °F<µ< 8. °F
(Round to three decimal places as needed.)
Expert Solution
This question has been solved!
Explore an expertly crafted, step-by-step solution for a thorough understanding of key concepts.
This is a popular solution!
Trending now
This is a popular solution!
Step by step
Solved in 3 steps with 3 images

Follow-up Questions
Read through expert solutions to related follow-up questions below.
Follow-up Question

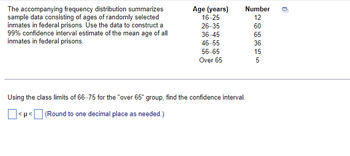
Transcribed Image Text:The accompanying frequency distribution summarizes
sample data consisting of ages of randomly selected
inmates in federal prisons. Use the data to construct a
99% confidence interval estimate of the mean age of all
inmates in federal prisons.
Age (years)
16-25
26-35
36-45
46-55
56-65
Over 65
<μ<[
Number
12
60
65
36
Using the class limits of 66-75 for the "over 65" group, find the confidence interval.
(Round to one decimal place as needed.)
15
5
U
Solution


