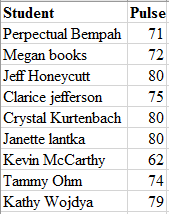
The accompanying data represent the pulse rates (beats per minute) of nine students enrolled in a statistics course. Treat the nine students as a population. Complete parts (a) through (c). Click the icon to view the data on the students' pulse rates.
The accompanying data represent the pulse rates (beats per minute) of nine students enrolled in a statistics course. Treat the nine students as a population. Complete parts (a) through (c). Click the icon to view the data on the students' pulse rates.

MATLAB: An Introduction with Applications
6th Edition
ISBN:9781119256830
Author:Amos Gilat
Publisher:Amos Gilat
Chapter1: Starting With Matlab
Section: Chapter Questions
Problem 1P

Related questions
Question

Transcribed Image Text:The accompanying data represent the pulse rates (beats per minute) of nine students enrolled in a statistics course. Treat the nine students as a population.
Complete parts (a) through (c).
: Click the icon to view the data on the students' pulse rates.
(a) Compute the population standard deviation.
beats per minute
(Round to one decimal place as needed.)
(b) Determine the sample standard deviation of the following three simple random samples of size 3.
Sample 1: {Janette, Kevin, Tammy}
Sample 2: {Megan, Kevin, Tammy}
Sample 3: {Crystal, Jeff, Kevin}
The sample standard deviation, s, of sample 1, {Janette, Kevin, Tammy}, is
(Round to one decimal place as needed.)
beats per minute.
The sample standard deviation, s, of sample 2, {Megan, Kevin, Tammy}, is beats per minute.
(Round to one decimal place as needed.)
The sample standard deviation, s, of sample 3, {Crystal, Jeff, Kevin}, is
beats per minute
(Round to one decimal place as needed.)
(c) Which samples underestimate the population standard deviation? Which overestimate the population standard deviation?
Sample 1
V the population standard deviation.
Sample 2
V the population standard deviation.
Sample 3
V the population standard deviation.
Expert Solution
Step 1
(a)
Step1: Enter the data in the worksheet. The screenshot will be:
Step 2: Use formula to calculate population standard deviation as:
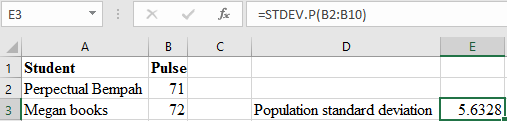
Part a
The population standard deviation is computed as 5.6328.

Trending now
This is a popular solution!

Step by step
Solved in 2 steps with 4 images

Recommended textbooks for you
MATLAB: An Introduction with Applications
Statistics
ISBN:
9781119256830
Author:
Amos Gilat
Publisher:
John Wiley & Sons Inc

Probability and Statistics for Engineering and th…
Statistics
ISBN:
9781305251809
Author:
Jay L. Devore
Publisher:
Cengage Learning

Statistics for The Behavioral Sciences (MindTap C…
Statistics
ISBN:
9781305504912
Author:
Frederick J Gravetter, Larry B. Wallnau
Publisher:
Cengage Learning
MATLAB: An Introduction with Applications
Statistics
ISBN:
9781119256830
Author:
Amos Gilat
Publisher:
John Wiley & Sons Inc
Probability and Statistics for Engineering and th…
Statistics
ISBN:
9781305251809
Author:
Jay L. Devore
Publisher:
Cengage Learning
Statistics for The Behavioral Sciences (MindTap C…
Statistics
ISBN:
9781305504912
Author:
Frederick J Gravetter, Larry B. Wallnau
Publisher:
Cengage Learning

Elementary Statistics: Picturing the World (7th E…
Statistics
ISBN:
9780134683416
Author:
Ron Larson, Betsy Farber
Publisher:
PEARSON

The Basic Practice of Statistics
Statistics
ISBN:
9781319042578
Author:
David S. Moore, William I. Notz, Michael A. Fligner
Publisher:
W. H. Freeman

Introduction to the Practice of Statistics
Statistics
ISBN:
9781319013387
Author:
David S. Moore, George P. McCabe, Bruce A. Craig
Publisher:
W. H. Freeman