The accompanying data represent the monthly rate of return of a certain company's common stock for the past few years. Complete parts (a) and (b) below. O Click the icon to view the data table. (a) Determine and interpret the quartiles. The first quartile is Q, = O (Round to four decimal places as needed.) The second quartile is Q2 - (Round to four decimal places as needed.) The third quartile is Q, - (Round to four decimal places as needed.) Interpret the quartiles. Choose the correct answer below. O A. All monthly returns within one standard deviation of the mean are contained in the first quartile, all monthly returns within two standard deviations of the mean are contained in the second quartile, and all monthly returns within three standard deviations of the mean are contained in the third quartile. O B. The first quartile is the lower bound of plausible monthly returns, and the third quartile is the upper bound of plausible monthly returns. Any monthly return outside of these bounds are outliers. The second quartile represents the most common monthly return. OC. The first quartile is one standard deviation below the mean (or average monthly return), the second quartile is the mean, and the third quartile is one standard deviation above the mean. O D. Of the monthly returns, 25% are less than or equal to the first quartile, 50% are less than or equal to the second quartile, and 75% are less than or equalt the third quartile. (b) Check the data set for outliers. Select the correct choice below and, if necessary, fillin the answer box to complete your choice. O A. The outlier(s) is/are (Type an integer or a decimal. Do not round. Use a comma to separate answers as needed.) O B. There are no outliers in the data set.


Inverse Normal Distribution
The method used for finding the corresponding z-critical value in a normal distribution using the known probability is said to be an inverse normal distribution. The inverse normal distribution is a continuous probability distribution with a family of two parameters.
Mean, Median, Mode
It is a descriptive summary of a data set. It can be defined by using some of the measures. The central tendencies do not provide information regarding individual data from the dataset. However, they give a summary of the data set. The central tendency or measure of central tendency is a central or typical value for a probability distribution.
Z-Scores
A z-score is a unit of measurement used in statistics to describe the position of a raw score in terms of its distance from the mean, measured with reference to standard deviation from the mean. Z-scores are useful in statistics because they allow comparison between two scores that belong to different normal distributions.
![The accompanying data represent the monthly rate of return of a certain company's common stock for the past few years. Complete parts (a) and (b) below.
E Click the icon to view the data table.
(a) Determine and interpret the quartiles.
The first quartile is Q, =]
(Round to four decimal places as needed.)
The second quartile is Q2 =D
(Round to four decimal places as needed.)
The third quartile is Qg =D:
(Round to four decimal places as needed.)
Interpret the quartiles. Choose the correct answer below.
O A. All monthly returns within one standard deviation of the mean are contained in the first quartile, all monthly returns within two standard deviations of the
mean are contained in the second quartile, and all monthly returns within three standard deviations of the mean are contained in the third quartile.
O B. The first quartile is the lower bound of plausible monthly returns, and the third quartile is the upper bound of plausible monthly returns. Any monthly returns
outside of these bounds are outliers. The second quartile represents the most common monthly return.
OC. The first quartile is one standard deviation below the mean (or average monthly return), the second quartile is the mean, and the third quartile is one
standard deviation above the mean.
OD. Of the monthly returns, 25% are less than or equal to the first quartile, 50% are less than or equal to the second quartile, and 75% are less than or equal to
the third quartile.
(b) Check the data set for outliers. Select the correct choice below and, if necessary, fill in the answer box to complete your choice.
O A. The outlier(s) is/are
(Type an integer or a decimal. Do not round. Use a comma to separate answers as needed.)
B. There are no outliers in the data set.
Rate of Return
0.26
0.26
0.04
0.06
0.06 - 0.04 - 0.04
0.22
0.48
0.06 - 0.14
0.19
0.05
0.18
0.09
0.02
- 0.05 - 0.02
0.08
0.02 - 0.02
0.13 - 0.08 - 0.02
0.06 -0.01
0.07 -0.05
0.01 -0.10
0.02
0.03
0.01
0.11
-0.11
0.09
0.10
0.25 - 0.02
0.03
Print
Done](/v2/_next/image?url=https%3A%2F%2Fcontent.bartleby.com%2Fqna-images%2Fquestion%2F55f6dedb-41ea-404f-9495-5e206029c9e3%2F9a32fdd4-ba3c-40c0-8b76-df25fa8f487d%2Fiyqvpui_processed.jpeg&w=3840&q=75)
To determine Quartiles for the given data:
Quartiles are partition values which divide the data set into four equal parts.
First Quartile divides lowest 25% of the data.
Enter the data in Excel.
Using Excel formula "=QUARTILE(A1:A40,1)"
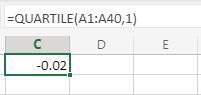
From the above output, the first Quartile is -0.0200
Interpretation:
There are 25% monthly rate of returns that are less than -0.02 and 75% monthly rate of returns more than -0.02.

Trending now
This is a popular solution!

Step by step
Solved in 2 steps with 3 images


