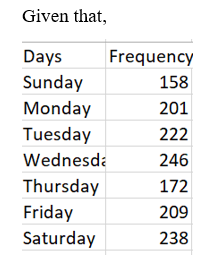
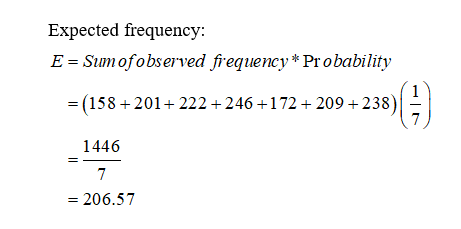
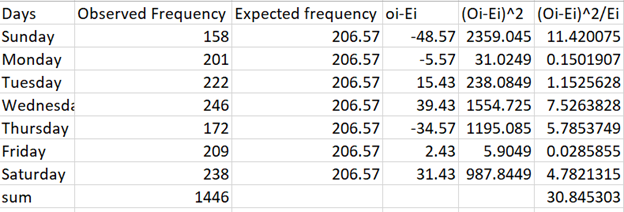
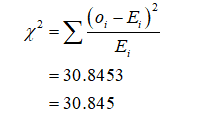
test statistic x2 & pvalue
Q: A mammography screening test for breast cancer was performed on 500 females. Screening test was…
A: given the number of females =500, and the Screening test was for 100 individuals. Out of 100, 40…
Q: 2An executive believes that no more than 81% of the company’s employees take all of their vacation…
A:
Q: Currently, total average time a patient spent time in a local health clinic is 47 minutes. A new…
A:
Q: The test that is used for comparing two or more populations when the response variable is…
A: We have given that the statement about to the Chi-Square test. Here, need to find out the correct…
Q: If nothing else changed besides an increase in sample size, the test statistic would be *fill in…
A: The test statistic: A function of sample observations that are used to test H0 is called a test…
Q: Select one of the statistical analysis methods: z-Score or t-Test Describe how we can apply the…
A: Here we conduct T test for mean . The example given below.
Q: University officials hope that changes they have made have improved the retention rate. Last year, a…
A: Given information: For sample 1 last year: The sample size is n1=2088. The favorable case is…
Q: When the _ is calculated, the _ is calculated as an intermediate step. a)variance; standard…
A: Variance is the sum of squared deviations divided by number of observations. Variance is calculated…
Q: Early Preterm Late Preterm Most pregnancies are full term, but some are preterm (less than 37…
A: Solution-: Our aim to find (a) Hypothesis (b) Test statistic=? (c) p-value =? To test is there…
Q: Most adults would erase all of their personal information online if they could a software firm of…
A: Given data, n=413 p^=0.59 Population proportion p=0.5 Test statistic=?
Q: assume that a contingency table analysis with 6 rows and 3 columns the calculated value for X2 is…
A: Given that Row=6 , Columns=3 Chi-square=χ2=25.82
Q: The performance of students at a local community was recorded and categorized based on student’s…
A: Low Average High Total Science 12 30 52 94 15.67 29.24 49.09…
Q: Employees of a state university system can choose from among four different health plans. Each plan…
A: For the given data Perform Anova one way test
Q: Locate sufficient statistic in Poisson distribution for tack lembda
A:
Q: What is the factorization theorem in statistic ?
A: The necessary and sufficient condition for a distribution to admit sufficient statistic is provided…
Q: The accompanying table shows results of challenged referee calls in a major tennis tournament. Use a…
A:
Q: For the frequency distribution shown, compute : mean , median , mode , mean deviation , sample…
A: Since you have posted a question with multiple sub-parts, we will solve first three sub- parts for…
Q: 3. An extensive study of the cost of health care in the United States presented data showing t the…
A:
Q: Most adults would erase all information online if they could 113 random selected adults showed that…
A: The random variable erase all of their personal information online is normally distributed. The…
Q: Test the claim about the difference between two population means 4 and 2 at the level of…
A:
Q: Find the sample variance and standard deviation 4, 48, 15, 50, 33, 24, 29,32,28,28 Part 1) A. s^2…
A:
Q: test statistic and p value are incorrect. please provide correct solutions!!
A: s1=170.97 s2=118.25
Q: Participants' cholesterol levels were collected at 3 different time points (before the margarine…
A: Was the Repeated Measures ANOVA significant? Since we have the P-value less than significance…
Q: The table shows the results from data generated to determine the significant difference on the…
A: The following table is given, Levene's test for equality of variance t-test for equal…
Q: It is known through Operation Laban Altapresyon that 15% of adults from the Province of Realeza are…
A: Given, It is known through Operation Laban Altapresyon that 15% of adults from the Province of…
Q: how to write a null and alternative hypothesis that can be tested using paired sample t-test
A: Paired Sample t-test is applied on the sample of data and analyzed results before and after the…
Q: What is mean of pareto chart
A: What is mean of pareto chart ?
Q: The First Table below records employees’ annual salary (in $000) by gender and University…
A: Null hypothesis, H0: There is Statistical differences in the average salary between different…
Q: O The students in online statistics class spend fewer hours of studying per week than the average…
A: Here t-statistic is 5.36 and degrees of freedom ( n - 1 ) = 25 - 1 = 24
Q: he partial credibility premium is calculated as 706 for 400 observations with mean loss of 00. It is…
A:
Q: Iwo sampies are inaepenaent simpie ranaom sampies seiectea trom normainy distributed populations,…
A: The null and alternative hypotheses are: Here, µ1 is the mean treatment, and µ2 is the mean placebo.…
Q: Explain the uses and misuses of statistic , support ur answer with logical reasoning
A: There are so many uses of statistics as below: 1) Statistics provides a good representation of data…
Q: A research team used a latin square design to test three drugs A, B, C for their effect in…
A: By the problem,The no.weak,of treatment and no. of patient =m=3 From the Table-3, The three…
Q: A study of seat belt users and nonusers yielded the randomly selected sample data summarized in the…
A: From the given information, Formula for Expected frequency:
Q: In a recent poll of 800 Democrats and 950 Republicans, 696 of the Democrats and 656 of the…
A: Democrats are taken as group 1. Republicans are taken as group 2. Given:…
Q: Listed below are six randomly selected heights of women and men from a recent epidemiological study…
A: The objective of this question is to test the claim that the mean height of women is the same as the…
Q: uppose that you did a Right-Tailed Test and that the Observed Test Statistic is outside the…
A: Decision Rule: For right tailed test, If the test statistic is greater than the critical value, then…
Q: When do we use Chi2 Test, i.e. what statistic does it involve?
A: Chi-square test is used for Categorical Variables. It is used to test the significant difference…
Q: According to a study, the proportion of individuals in which cover their mouths when sneezing is…
A: Z score for single proportion test is use for testing the proportion
Q: suggest a statistical tool given that sample size is 40, and non parametric significant difference…
A: Statistical tools are used for planning, designing, analyzing and interpreting the results to make…
Q: how do I use statcrunch to form a 90% confidence interval for variance
A: Confidence interval: A range of values such that the population parameter can expected to contain…
Q: he mean time taken to submit an assignment by a student was 20 days according to the previous…
A: Excel can be used to calculate the required sum
Calculate the test statistic x2 & pvalue
Step by step
Solved in 7 steps with 5 images
- I AM RESUBMITTING THIS QUESTION FOR DIFFERENT PARTS. I AM AT THE SECOND NUMBER 2 QUESTION "P-VALUE =". Before the furniture store began its ad campaign, it averaged 160 customers per day. The manager is investigating if the average has changed since the ad came out. The data for the 16 randomly selected days since the ad campaign began is shown below: 131, 127, 148, 143, 141, 153, 158, 145, 138, 163, 164, 148, 166, 154, 170, 133 Assuming that the distribution is normal, what can be concluded at the αα = 0.05 level of significance? For this study, we should use Select an answer t-test for a population mean z-test for a population proportion The null and alternative hypotheses would be: H0:H0: ? μ p Select an answer < = ≠ > H1:H1: ? p μ Select an answer = > ≠ < The test statistic ? t z = (please show your answer to 3 decimal places.) The p-value = (Please show your answer to 4 decimal places.) The p-value is ? ≤ > αα Based on this, we…21WB_MATH_1016_WBON Ashley Ramos & Homework: Unit 7 Homework Save Score: 0.83 of 5 pts 6 of 14 (11 complete) HW Score: 49.17%, 24.58 of 50 pts 7.2.31-T Question Help A random sample of 75 eighth grade students' scores on a national mathematics assessment test has a mean score of 293. This test result prompts a state school administrator to declare that the mean score for the state's eighth graders on this exam is more than 285. Assume that the population standard deviation is 32. At a = 0.14, is there enough evidence to support the administrator's claim? Complete parts (a) through (e). (a) Write the claim mathematically and identify Ho and Ha. Choose the correct answer below. O A. Ho: H2285 (claim) O B. Ho: H= 285 (claim) Ha:H> 285 Ψc. H : μ# 285 Ha:H 285 (claim) OD. Ho:H= 285 Ο Ε. H : μ 285 Hai H> 285 (claim) (b) Find the standardized test statistic z, and its corresponding area. z = 2.17 (Round to two decimal places as needed.) (c) Find the P-value. P-value = (Round to three decimal…Is it possible for a statistic to be unbiased yet very imprecise? How about being very accurate but biased?
- Are freshmen psychology majors less likely to change their major before they graduate compared to freshmen business majors? 454 of the 687 freshmen psychology majors from a recent study changed their major before they graduated and 439 of the 619 freshmen business majors changed their major before they graduated. What can be concluded at the = 0.05 level of significance? The test statistic z = (please show your answer to 3 decimal places.) The p-value = (Please show your answer to 4 decimal places.)Prof. X has been monitoring all stats students' anxiety levels by covertly measuring micro-expressions with in-class video surveillance during each exam (including this one!). Prof. X wants to determine if anxiety levels differed across the three exams. Which statistical test should be used? Select one: a. One-way between subjects ANOVA Incorrect b. One-way repeated measures ANOVA c. Two-way between subjects ANOVA d. None of these optionsIn 1995, the proportion of all mutual funds that beat their benchmark indices was .42. In 2002, a random sample of 200 mutual fund, it was found that 74 beat their benchmark indices. a) At the 1% level of significance, test to see if the proportion of funds beating their benchmark indices has decreased since 1995 b) What is the p-value? Write down all formulas and hypothesis
- High IQ Exercise 26 proposes modeling IQ scores withN(100, 16). What IQ would you consider to be unusuallyhigh? Explain.b) what is the correcr DF? option: 979, 973, 940, 934 c) which predictor is the most significan variable? option: smoke, height, age, gestation, weight, first_pregnancy d) which predictor is the least significan variable? option: smoke, height, age, gestation, weight, first_pregnancyDo wearable devices that monitor diet and physical activity help people lose weight? Researchers had 237 subjects, already involved in a program of diet and exercise, use wearable technology for 24 months. They measured their weight (in kilograms) before using the technology and 24 months after using the technology. (a) Explain why the proper procedure to compare the mean weight before using the wearable technology and 24 months after using the wearable technology is a matched pairs t test. Choose the correct explanation. A person's weight before and after wearing the device would not be independent; thus, the data from this before and after study should be analyzed using a matched pairs t test. O A person's weight before and after wearing the device would be independent; thus, the data from this before and after study should be analyzed using a matched pairs t test. O A person's weight before and after wearing the device would be independent; thus, the data from this before and after…
- Data from the Motor Vehicle Department indicate that 80% of all licensed drivers are older than age 25. Information on the age of n = 50 people who recently received speeding tickets was sourced by researchers who are interested in whether the age distribution for the sample of drivers who recently received speeding tickets is different from the age distribution for the population of licensed drivers. 17 people are 25 or younger, 33 people are older than 25. 1) Test assumptions and make a decision (please provide written evidence to support your decision): 2) Inferential statistic(s) and p-value(s): 3) Decision:Find the missing values ‘*’, ‘**’, ‘***’, Showing necessary workingWhat test should you use to analyze these results, and why? Will you use a one-tailed or a two-tailed test? Also, what is the result of your analysis?