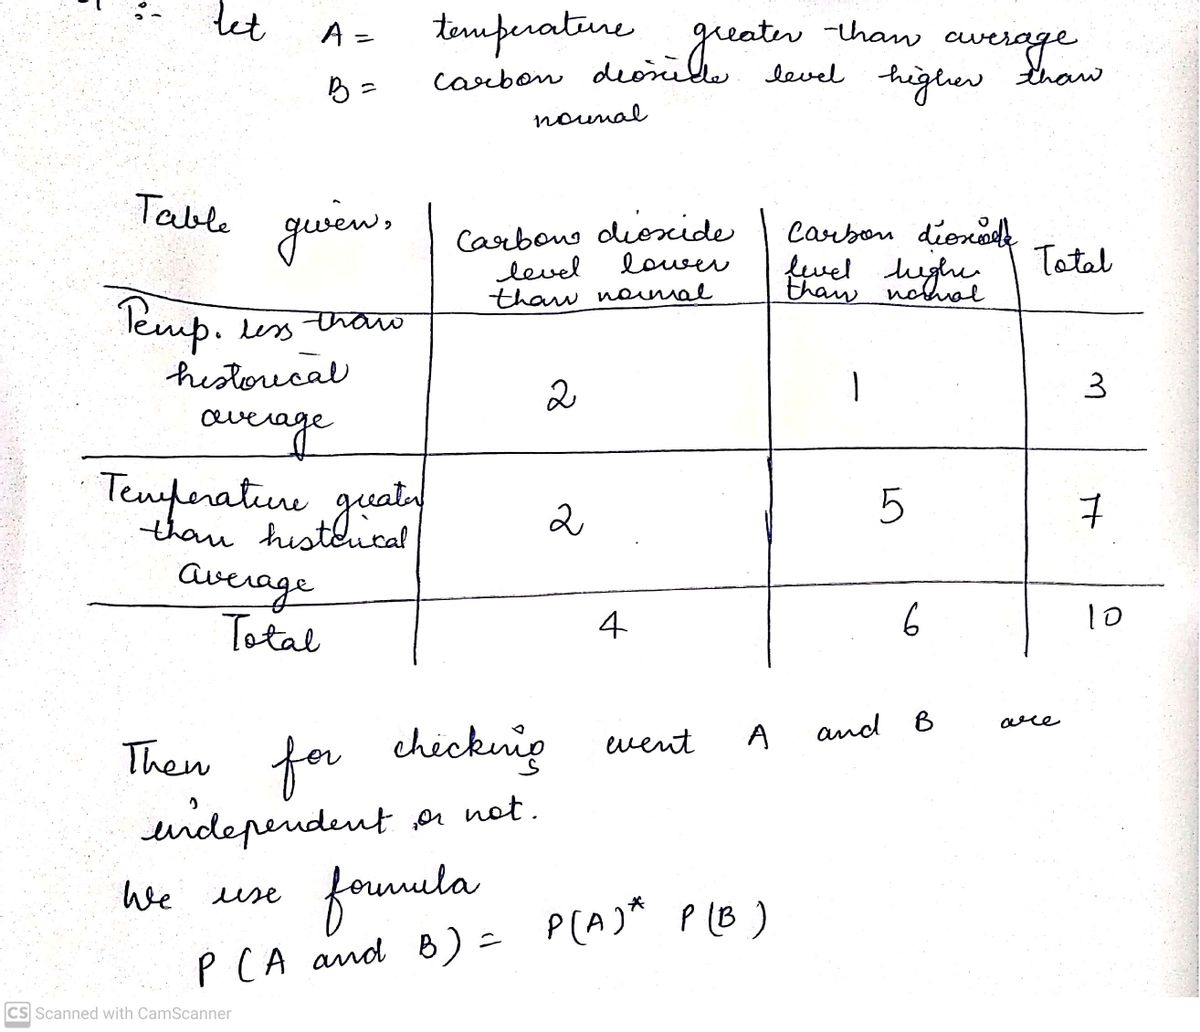
temp greater than average' and 'carbon dioxide levels higher than normal' are INDEPENDENT or DEPENDENT


Q: Explain what type of variables ‘Happiness Score’, ‘Log GDP per capita’ and ‘Social Support’ are,…
A: The objective is to define the variable type for the provided set of variables "Happiness score",…
Q: How do the results compare to the percentage using the empirical rule?
A: Empirical rule: The empirical rule states that it was for a normal distribution data. It falls…
Q: Using SAS, draw a scatterplot between variables CRIME_RATE and PROP_CHANGE_INCOME. Attach the…
A: Introduction: It is required to determine if the two variables, CRIME_RATE and PROP_CHANGE_INCOME…
Q: Your answer is incorrect. Observed monthly heating cost: Your answer is incorrect. Predicted…
A: Given Regression equation is y=-0.9x+80.81
Q: Overproduction of uric acid in the body can be an indication of cell breakdown. This may be an…
A:
Q: Some studies have noticed a positive correlation between the number of procedures performed (volume)…
A: We have to answer of the given question, either true or false.
Q: (a) If per capita GDP rises by $1,000, by how much does the % of GDP spent on health change? (b) If…
A: Cosnider the given output:
Q: 12. A psychologist uses a treatment method called Cognitive Behavioral Therapy (CBT) to help reduce…
A: given μd = 35 Sample mean: Md = 8.2 Sample standard deviation: sd = 426.3^0.5 = 20.65 n = 30…
Q: Finally , the researcher considers using regression analysis to establish a linear relationship…
A: a. In regression analysis the independent variable is used to predict the dependent variable.
Q: Last bowl! For Exercise 1’s regression model predicting potassium content (in milligrams) from the…
A: Given: Se = 30.77 The standard error is defined as the deviation of the sample mean from the true…
Q: Please calculate the thickness that 80.0 percent of the products thicknesses are thinner than or…
A: Given: Let X = thickness X is lognormally distributed with mean μ = 8.5 inches and standard…
Q: The average temperature of Hamilton in January 2020 was less than 32°F (0°C). The data is available…
A: Given information: Days Temperature 1 28 2 41 3 43 4 34 5 32 6 34 7 36 8 23 9…
Q: You are given: I. is the force of mortality for a life age & under the Standard Ultimate Life Table.…
A: In the context of life contingencies, the quantity lx represents the number of survivors at age x…
Q: Suppose X1, ..., Xn are iid with PDF f (x | 0) = 40ªx-5. x > 0, where 0 > 0. Find the method of…
A:
Q: What is the expected average height of 8 year old boys, using the regression equation?
A: From the given information, the obtained regression equation is y=27.84+2.573x.
Q: Based on the attached ogive curve, determine approximately what percentage of the body weight is…
A: The percentage formula is, Percentage=Number of favourable observationsTotal number of…
Q: Overproduction of uric acid in the body can be an indication of cell breakdown. This may be an…
A:
Q: What did the equation of the best fit line of the standard curve allow you to calculate
A: Line of best fit: Software procedure for regression in Excel. Enter the given data in EXCEL sheet…
Q: A multiple regression model has the form y^=b0+b1x1+b2x2 The coefficient b1 is interpreted as…
A: The coefficient b1 is interpreted as the:
Q: please highlight the correct answer
A: The correct answer is, Increased stress increases the rate of aging, as seen by shorter telomeres.
Q: 1. Does the bat make a difference? This was a question of interest at the regional little league…
A:
Q: Investigators want to assess the association between initial serum cholesterol levels (mg/100ml) and…
A: From the provided information, it is interpreted that: The response variable is "the presence of…
Q: In 2017, the entire fleet of light‑duty vehicles sold in the United States by each manufacturer must…
A:
Q: Accountants at the Tucsan firm Larry Youdleman cpas believed that several traveling executives were…
A: Here we will find the Expected tr avel cost Expected travel cost =$95+$50.50X1+$0.40X2 In this part…
Q: 1. If we assume that the distribution of Δ is normally distributed, then what % of (observer,…
A: From given data we have : mean μ=0.189 Standard deviation σ=2.428 △~Normal(μ,σ2)
Q: Last tank! For Exercise 2’s regression model predicting fuel economy (in mpg) from the car’s…
A: The regression model predicts the value of fuel economy from car’s horsepower. The se =3.287.
Q: A negative correlation between variables X and Y will always result in a positive slope in the…
A: Variables X and Y have negative correlation between them. Let, r be correlation coefficient and…
Q: The relationship between the cost of a taxi ride (y) and the length of ride (x) is analyzed and is…
A: Hello! As you have posted more than 3 sub parts, we are answering the first 3 sub-parts. In case…
Q: Means for the main effects are often referred to as marginal means. True False
A: Statement : Means for the main effects are often referred to as marginal means.
Q: Show that E(y^2)= standard deviation square y plus residual square capital Y
A: Variance: Variance measures how much a set of numbers (or a random variable) varies from the average…
'temp greater than average' and 'carbon dioxide levels higher than normal' are INDEPENDENT or DEPENDENT


Step by step
Solved in 2 steps with 2 images

- Imagine you would like to estimate the following model Bo B₁cigarettes_day + u health = where health is self-rated health on a 1 to 5 scale (5 = very healthy) and cigarettes_day is the number of cigarettes the person smokes per day (on average). Imagine you would like to estimate B₁ using an instrumental variable (IV) regression. As instrument, you would use the variable female, which is equal to 1 if the person is female and 0 otherwise. For the situation described above, a) state the IV relevance assumption b) state the IV exogeneity assumption In your answer, use the actual variable names (instead of e.g. x, y and z).What the the estimated marginal effect at the mean?What does this data mean if the values are logistic regression analysis of presence of sarcopenia as the dependent variable OR (95% CI) p-value 3.069 (1.42-6.62) 0.004
- The variable income (yearly) is examined in a regression setting where the predictor variable is the lag (1) of income and the following output is produced. a) Write down the regression equation. b) Interpret the meaning of the slope. c) A dummy variable for gender (male=0, female=1) was added to the model. Interpret its coefficient of -0.2. Us_change %>% model(TSLM(log(Income) ~ log(LagIncome))) %>% report() #> Series: Consumption #> Model: TSLM #> #> Residuals: #> Min 1Q Median 3Q Max #> -2.5824 -0.2778 0.0186 0.3233 1.4223 #> #> Coefficients: #> Estimate Std. Error t value Pr(>|t|) #> (Intercept) 0.5445 0.0540 10.08 < 2e-16 *** #> Log(LagIncome) 1.1000 0.0467 5.82 2.4e-08 *** #> --- #> Signif.codes: 0 '***'0.001'**'0.01'*' 0.05'.' 0.1 ' ' 1 #> #> Residual standard error: 0.591 on 196 degrees of freedom #>…Internet speeds are a heavily advertised selling point of Internet Service Providers. You notice that although you are paying for a certain speed, the true speed seems to vary depending on where you are in your house. In order to estimate the true average speed you are getting in your house, you go to 13 random spots around your house and record the speed (in MBs per second) shown from a test at 'www.speedtest.net'. You see that the average is 5.61 MB/s with a standard deviation of 1.274 MB/s. You decide to create a 99% confidence interval for the average internet speed in your house. What is the margin of error for this estimate?What test involves an analysis of rate of change in Y per single point increase in X and what is the “predictor”?
- What is the regression equation and what is the value of y^y^ when x = 25? Group of answer choices 24.94 + 1.95x; 84.94 1.95 + 24.94x; 25 1.95 + 24.94x; 625.45 24.94 + 1.95x; 73.69 None of the aboveA researcher has conducted a study to investigate the relationship between how important a person thinks appearance is and how much they spend on clothes each month, The first variable was 'self- rating of the importance of appearance' measured on a ten point scale (where 1 = not important and 10 = extremely important). The second variable was 'amount of money spent on clothes each month' measured by asking people to estimate to the nearest five pounds how much they spent in a typical month, The results are in the table below: Participant Self-rating of Amount spent on of clothes month (Maloti) s (initials) importance each appearance HP 6 80 EP 8 120 SF 100 PR 110 MS 75 JP 36 AG 15 BF 50 (a) Describe how an appropriate descriptive statistic could be used with the data in this table. (b) Provide 2 reasons to justify your choice. (c) which inferential statistical (parametric and non-parametric) test would you use to analyze the data - give 2 reasons for your choices (d) Provide 2 reasons…I have a dataset from 600 preschoolers with measures of grip strength for each individual. One individual subject had a z score of -1.5. Approximately how many preschoolers would have a grip strength lower than this individual. Show work please I don't understand
- Overproduction of uric acid in the body can be an Indication of cell breakdown. This may be an advance indication of liness such as gout, leukemia, or lymphoma. Over a period of months, an adult male patient has taken five blood tests for uric acid. The mean concentration was x- 5.35 mg/dl. The distribution of uric acid in healthy adult males can be assumed to be normal, with a-1.81 mg/dl. (a) Find a 95 % confidence interval for the population mean concentration of uric acid in this patient's blood. What is the margin of error? (b) What conditions are necessary for your calculations? (c) Interpret your results in the context of this problem. (d) Sample size Find the sample size necessary for 95% confidence level with a maximal margin of error E = 1.10 for the mean concentration of uric acid in this patient's blood. Thank you26) Below is some of the regression output from a simple regression of the number of wins for a major league baseball team and the size amount of money the team is paying its players (expressed in millions of $'s) *fill in the blank table* Suppose that the team owner is trying to decide whether to pay a particular free agent player. Based on the player's previous statistics, the owner thinks that the new player can help his team increase the number of wins but the new player is going to cost more than the player he will be replacing. The owner decides it is a good idea to sign the new player if he can be pretty sure that the coefficient is at least 0.20. When testing this hypothesis, what is the test statistic? (please express your answer using 2 decimal places)Data were recorded for 117 months on a household's gas bill (in dollars) and the average monthly temperatures for its neighborhood. The mean monthly temperature was 48.7°F with a standard deviation of 20.6. The mean gas bill price was $81.20 with a standard deviation of 66.5. The correlation coefficient between monthly temperature and gas bill price is -0.92. 22) Determine the correct value of the slope for the linear model that predicts gas bill price from monthly temperature and interpret it in context. The slope is - 2.97. For every one degree increase in monthly temperature, the gas bill price is predicted to decrease by $2.97. The slope is - 0.28. For every one degree increase in monthly temperature, the gas bill price is predicted to decrease by $0.28. The slope is - 2.97. For every one dollar increase in gas bill price, the monthly temperature is predicted to decrease by 2.97°. The slope is - 0.28. For every one dollar increase in gas bill price, the monthly temperature…
