TABLE 2 TABLE 3 Phoenix, AZ Average Temperatures Month Attendance 40,000 - 35,000 Jan January February 54 6,500 30,000 Feb 58 6,600 25,000 Mar 62 March 15,800 20,000 Apr 70 April 26,000 15,000 - May 79 May 38,000 10,000 - Jun 88 June 36,000 5,000 - Jul 94 31,300 July August September 2 3 4 5 6 7 8 9 10 1 12 1: Aug 92 23,500 Sep 86 12,000 Figure 14 Oct 75 October 4,000 Nov 62 November 900 Dec 54 December 2,100
TABLE 2 TABLE 3 Phoenix, AZ Average Temperatures Month Attendance 40,000 - 35,000 Jan January February 54 6,500 30,000 Feb 58 6,600 25,000 Mar 62 March 15,800 20,000 Apr 70 April 26,000 15,000 - May 79 May 38,000 10,000 - Jun 88 June 36,000 5,000 - Jul 94 31,300 July August September 2 3 4 5 6 7 8 9 10 1 12 1: Aug 92 23,500 Sep 86 12,000 Figure 14 Oct 75 October 4,000 Nov 62 November 900 Dec 54 December 2,100
Trigonometry (11th Edition)
11th Edition
ISBN:9780134217437
Author:Margaret L. Lial, John Hornsby, David I. Schneider, Callie Daniels
Publisher:Margaret L. Lial, John Hornsby, David I. Schneider, Callie Daniels
Chapter1: Trigonometric Functions
Section: Chapter Questions
Problem 1RE:
1. Give the measures of the complement and the supplement of an angle measuring 35°.
Related questions
Question
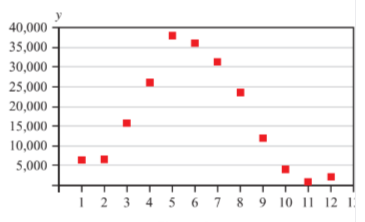
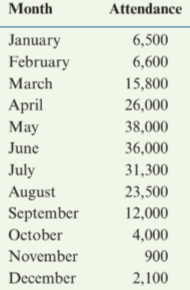
Table 3 shows the average monthly attendance at Lake
Nacimiento in California. Find the equation of a trigonometric
as a model for this data. (Source: Nacimiento Water Supply Project: Report on
Recreational Use at Lake Nacimiento)

Transcribed Image Text:TABLE 2
TABLE 3
Phoenix, AZ
Average Temperatures
Month
Attendance
40,000 -
35,000
Jan
January
February
54
6,500
30,000
Feb
58
6,600
25,000
Mar
62
March
15,800
20,000
Apr
70
April
26,000
15,000 -
May
79
May
38,000
10,000 -
Jun
88
June
36,000
5,000 -
Jul
94
31,300
July
August
September
2 3 4 5 6 7 8 9 10 1 12 1:
Aug
92
23,500
Sep
86
12,000
Figure 14
Oct
75
October
4,000
Nov
62
November
900
Dec
54
December
2,100
Expert Solution
Step 1
Below graph and table shows the average monthly attendance at Lake Nacimiento in California.


Step 2
Use the cosine function model, .
The amplitude A is the half of the difference between highest point and lowest point.
The vertical translation k is the average of highest point and lowest point.
The maximum value occur at and the minimum value occur at .
The horizonal distance between maximum and minimum values is the half of the period.
Period =
Step by step
Solved in 3 steps with 2 images

Knowledge Booster
Learn more about
Need a deep-dive on the concept behind this application? Look no further. Learn more about this topic, trigonometry and related others by exploring similar questions and additional content below.Recommended textbooks for you

Trigonometry (11th Edition)
Trigonometry
ISBN:
9780134217437
Author:
Margaret L. Lial, John Hornsby, David I. Schneider, Callie Daniels
Publisher:
PEARSON

Trigonometry (MindTap Course List)
Trigonometry
ISBN:
9781305652224
Author:
Charles P. McKeague, Mark D. Turner
Publisher:
Cengage Learning


Trigonometry (11th Edition)
Trigonometry
ISBN:
9780134217437
Author:
Margaret L. Lial, John Hornsby, David I. Schneider, Callie Daniels
Publisher:
PEARSON

Trigonometry (MindTap Course List)
Trigonometry
ISBN:
9781305652224
Author:
Charles P. McKeague, Mark D. Turner
Publisher:
Cengage Learning


Trigonometry (MindTap Course List)
Trigonometry
ISBN:
9781337278461
Author:
Ron Larson
Publisher:
Cengage Learning