Suppose you are interested in seeing whether the total number of days students are absent from high school correlates with their grades. You obtain school records that list the total absences and average grades (on a percentage scale) for 100 graduating seniors. You decide to use the computational formula to calculate the Pearson correlation between the total number of absences and average grades. To do so, you call the total number of absences X and the average grades Y. Then, you add up your data values (ΣX and ΣY), add up the squares of your data values (ΣX² and ΣY²), and add up the products of your data values (ΣXY). The following
Suppose you are interested in seeing whether the total number of days students are absent from high school correlates with their grades. You obtain school records that list the total absences and average grades (on a percentage scale) for 100 graduating seniors. You decide to use the computational formula to calculate the Pearson correlation between the total number of absences and average grades. To do so, you call the total number of absences X and the average grades Y. Then, you add up your data values (ΣX and ΣY), add up the squares of your data values (ΣX² and ΣY²), and add up the products of your data values (ΣXY). The following

MATLAB: An Introduction with Applications
6th Edition
ISBN:9781119256830
Author:Amos Gilat
Publisher:Amos Gilat
Chapter1: Starting With Matlab
Section: Chapter Questions
Problem 1P

Related questions
Question
5. Calculating the Pearson correlation and coefficient of determination
Suppose you are interested in seeing whether the total number of days students are absent from high school correlates with their grades. You obtain school records that list the total absences and average grades (on a percentage scale) for 100 graduating seniors.
You decide to use the computational formula to calculate the Pearson correlation between the total number of absences and average grades. To do so, you call the total number of absences X and the average grades Y. Then, you add up your data values (ΣX and ΣY), add up the squares of your data values (ΣX² and ΣY²), and add up the products of your data values (ΣXY). The following table summarizes your results:
| ΣX | 460 |
| ΣY | 8,060 |
| ΣX² | 3,446 |
| ΣY² | 659,226 |
| ΣXY | 36,477 |
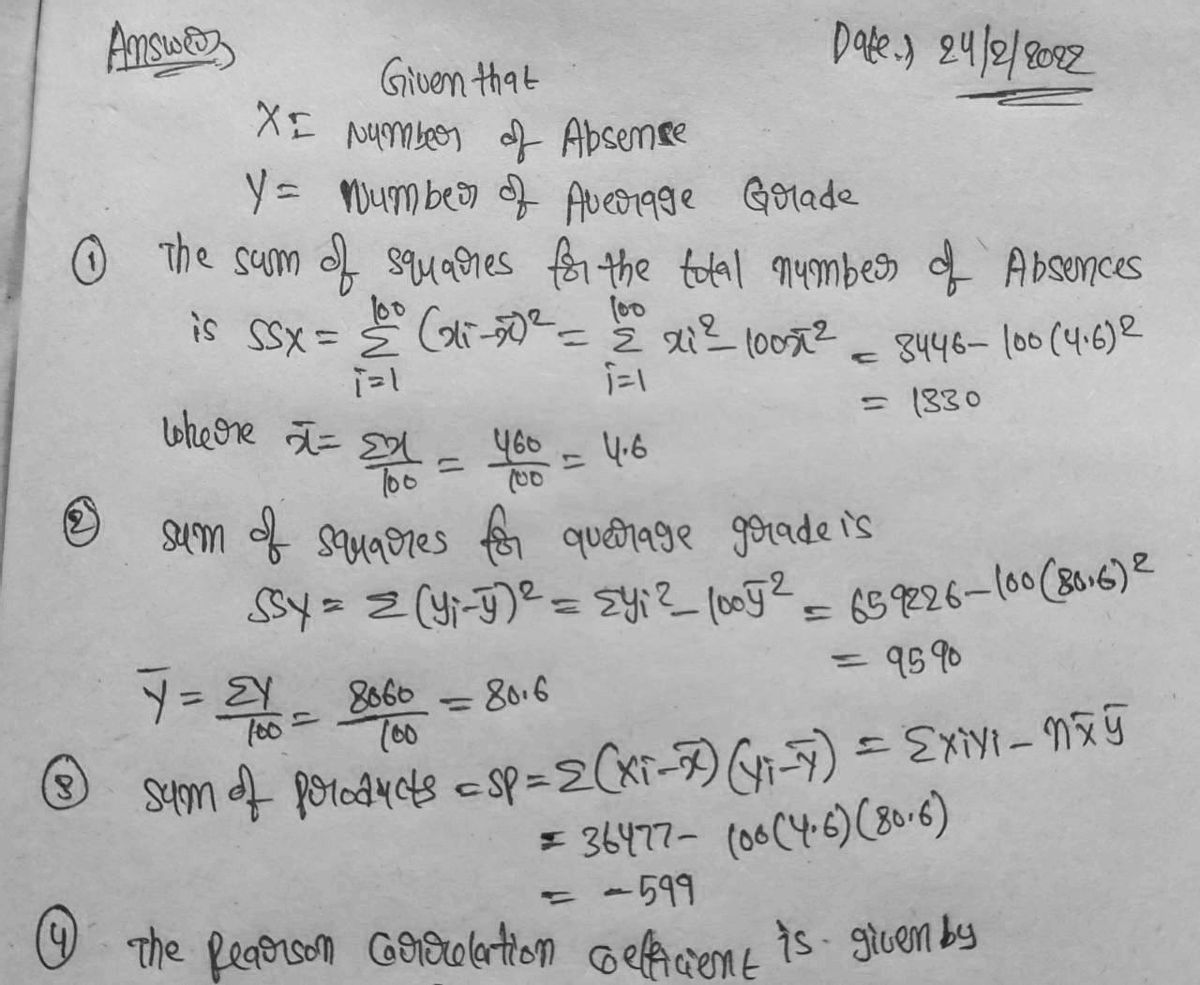
The sum of squares for the total number of absences is SSxx = .
The sum of squares for average grades is SSyy = .
The sum of products for the total number of absences and average grades is SP = .
The Pearson correlation coefficient is r = .
Suppose you want to predict average grades from the total number of absences among students. The coefficient of determination is r² = , indicating that of the variability in the average grades can be explained by the relationship between the average grades and the total number of absences.
When doing your analysis, suppose that, in addition to having data for the total number of absences for these students, you have data for the total number of days students attended school. You’d expect the correlation between the total number of days students attended school and the total number of absences to be and the correlation between the total number of days students attended school and average grades to be ..
Expert Solution
Step 1

Trending now
This is a popular solution!

Step by step
Solved in 3 steps with 3 images

Recommended textbooks for you
MATLAB: An Introduction with Applications
Statistics
ISBN:
9781119256830
Author:
Amos Gilat
Publisher:
John Wiley & Sons Inc

Probability and Statistics for Engineering and th…
Statistics
ISBN:
9781305251809
Author:
Jay L. Devore
Publisher:
Cengage Learning

Statistics for The Behavioral Sciences (MindTap C…
Statistics
ISBN:
9781305504912
Author:
Frederick J Gravetter, Larry B. Wallnau
Publisher:
Cengage Learning
MATLAB: An Introduction with Applications
Statistics
ISBN:
9781119256830
Author:
Amos Gilat
Publisher:
John Wiley & Sons Inc
Probability and Statistics for Engineering and th…
Statistics
ISBN:
9781305251809
Author:
Jay L. Devore
Publisher:
Cengage Learning
Statistics for The Behavioral Sciences (MindTap C…
Statistics
ISBN:
9781305504912
Author:
Frederick J Gravetter, Larry B. Wallnau
Publisher:
Cengage Learning

Elementary Statistics: Picturing the World (7th E…
Statistics
ISBN:
9780134683416
Author:
Ron Larson, Betsy Farber
Publisher:
PEARSON

The Basic Practice of Statistics
Statistics
ISBN:
9781319042578
Author:
David S. Moore, William I. Notz, Michael A. Fligner
Publisher:
W. H. Freeman

Introduction to the Practice of Statistics
Statistics
ISBN:
9781319013387
Author:
David S. Moore, George P. McCabe, Bruce A. Craig
Publisher:
W. H. Freeman