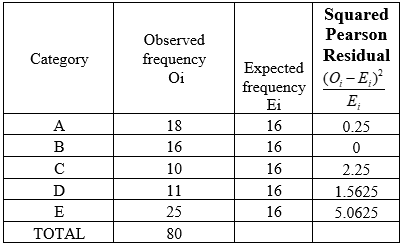
You are conducting a multinomial hypothesis test for the claim that all 5 categories are equally likely to be selected. Complete the table. | Category | Observed Frequency | Expected Frequency | Squared Pearson Residual | |----------|--------------------|--------------------|---------------------------| | A | 18 | | | | B | 16 | | | | C | 10 | | | | D | 11 | | | | E | 25 | | | What is the chi-square test statistic for this data? \[ x^2 = \, \] Report all answers accurate to three decimal places. **Question Help:** [Message instructor] **Submit Question**
You are conducting a multinomial hypothesis test for the claim that all 5 categories are equally likely to be selected. Complete the table. | Category | Observed Frequency | Expected Frequency | Squared Pearson Residual | |----------|--------------------|--------------------|---------------------------| | A | 18 | | | | B | 16 | | | | C | 10 | | | | D | 11 | | | | E | 25 | | | What is the chi-square test statistic for this data? \[ x^2 = \, \] Report all answers accurate to three decimal places. **Question Help:** [Message instructor] **Submit Question**

MATLAB: An Introduction with Applications
6th Edition
ISBN:9781119256830
Author:Amos Gilat
Publisher:Amos Gilat
Chapter1: Starting With Matlab
Section: Chapter Questions
Problem 1P

Related questions
Question
![You are conducting a multinomial hypothesis test for the claim that all 5 categories are equally likely to be selected. Complete the table.
| Category | Observed Frequency | Expected Frequency | Squared Pearson Residual |
|----------|--------------------|--------------------|---------------------------|
| A | 18 | | |
| B | 16 | | |
| C | 10 | | |
| D | 11 | | |
| E | 25 | | |
What is the chi-square test statistic for this data?
\[ x^2 = \, \]
Report all answers accurate to three decimal places.
**Question Help:** [Message instructor]
**Submit Question**](/v2/_next/image?url=https%3A%2F%2Fcontent.bartleby.com%2Fqna-images%2Fquestion%2F30ce24e3-8d93-4bc2-84c7-2a439fb9548b%2Fb942330c-ddac-42a9-9974-680ffd5045f2%2Fx56iri.jpeg&w=3840&q=75)
Transcribed Image Text:You are conducting a multinomial hypothesis test for the claim that all 5 categories are equally likely to be selected. Complete the table.
| Category | Observed Frequency | Expected Frequency | Squared Pearson Residual |
|----------|--------------------|--------------------|---------------------------|
| A | 18 | | |
| B | 16 | | |
| C | 10 | | |
| D | 11 | | |
| E | 25 | | |
What is the chi-square test statistic for this data?
\[ x^2 = \, \]
Report all answers accurate to three decimal places.
**Question Help:** [Message instructor]
**Submit Question**
Expert Solution
Step 1
Denote Oi as the observed frequency (i =A, B, C, D, E) and Ei as the expected frequency(i =A, B, C, D, E). Here, the sample size, n=.
The expected frequency will be (80)/5≈16.
Test statistic:
The formula for the test statistic is χ2 = ∑ [(Oi – Ei)2 / Ei], summed over all i .
The Table calculates [(Oi – Ei)2 / Ei]for each (i). So, the value in the first cell will be (18– 16)2 / 16 ≈ 0.25.
The test statistic value can be calculated by adding all these cell values.

Step by step
Solved in 2 steps with 1 images

Recommended textbooks for you
MATLAB: An Introduction with Applications
Statistics
ISBN:
9781119256830
Author:
Amos Gilat
Publisher:
John Wiley & Sons Inc

Probability and Statistics for Engineering and th…
Statistics
ISBN:
9781305251809
Author:
Jay L. Devore
Publisher:
Cengage Learning

Statistics for The Behavioral Sciences (MindTap C…
Statistics
ISBN:
9781305504912
Author:
Frederick J Gravetter, Larry B. Wallnau
Publisher:
Cengage Learning
MATLAB: An Introduction with Applications
Statistics
ISBN:
9781119256830
Author:
Amos Gilat
Publisher:
John Wiley & Sons Inc
Probability and Statistics for Engineering and th…
Statistics
ISBN:
9781305251809
Author:
Jay L. Devore
Publisher:
Cengage Learning
Statistics for The Behavioral Sciences (MindTap C…
Statistics
ISBN:
9781305504912
Author:
Frederick J Gravetter, Larry B. Wallnau
Publisher:
Cengage Learning

Elementary Statistics: Picturing the World (7th E…
Statistics
ISBN:
9780134683416
Author:
Ron Larson, Betsy Farber
Publisher:
PEARSON

The Basic Practice of Statistics
Statistics
ISBN:
9781319042578
Author:
David S. Moore, William I. Notz, Michael A. Fligner
Publisher:
W. H. Freeman

Introduction to the Practice of Statistics
Statistics
ISBN:
9781319013387
Author:
David S. Moore, George P. McCabe, Bruce A. Craig
Publisher:
W. H. Freeman