MAT14 References noke Mailings Review Draw Design b 13 ~,三~三|4 TNormal AaBbCcDc AaBbCcDcA - 12 AA Aa- 1No Spac.. Arial 三1 田、 BIU ab x, x A A- Paragraph Font 3. Below is unemployment data for NC over the last ten years (taken from the month of June) Year June 2011 10.3 2012 9 4 2013 8.4 2014 6.5 2015 2016 5.1 2017 4.4 2018 2019 4.1 2020 a. Create a properly labeled chart that shows how the unemployment rate has changed in NC over the last 10 years. b. What kind of chart did you use and why? What kind of chart did you use and why? YOU MUST ANSWER IN COMPLETE SENTENCES TO GET CREDIT. ge 3 of 4 365 words 们 Text Predictions: On * Accessibi Type here to search
MAT14 References noke Mailings Review Draw Design b 13 ~,三~三|4 TNormal AaBbCcDc AaBbCcDcA - 12 AA Aa- 1No Spac.. Arial 三1 田、 BIU ab x, x A A- Paragraph Font 3. Below is unemployment data for NC over the last ten years (taken from the month of June) Year June 2011 10.3 2012 9 4 2013 8.4 2014 6.5 2015 2016 5.1 2017 4.4 2018 2019 4.1 2020 a. Create a properly labeled chart that shows how the unemployment rate has changed in NC over the last 10 years. b. What kind of chart did you use and why? What kind of chart did you use and why? YOU MUST ANSWER IN COMPLETE SENTENCES TO GET CREDIT. ge 3 of 4 365 words 们 Text Predictions: On * Accessibi Type here to search

MATLAB: An Introduction with Applications
6th Edition
ISBN:9781119256830
Author:Amos Gilat
Publisher:Amos Gilat
Chapter1: Starting With Matlab
Section: Chapter Questions
Problem 1P

Related questions
Question

Transcribed Image Text:MAT14
References
noke
Mailings
Review
Draw
Design
b 13 ~,三~三|4
TNormal
AaBbCcDc AaBbCcDcA
- 12 AA Aa-
1No Spac..
Arial
三1
田、
BIU ab x, x A A-
Paragraph
Font
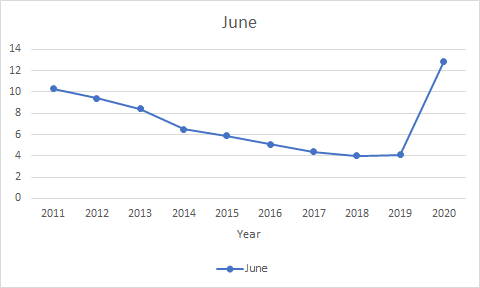
3. Below is unemployment data for NC over the last ten years (taken from the
month of June)
Year
June
2011
10.3
2012
9 4
2013
8.4
2014
6.5
2015
2016
5.1
2017
4.4
2018
2019
4.1
2020
a. Create a properly labeled chart that shows how the unemployment rate
has changed in NC over the last 10 years.
b. What kind of chart did you use and why? What kind of chart did you
use and why? YOU MUST ANSWER IN COMPLETE SENTENCES
TO GET CREDIT.
ge 3 of 4
365 words
们
Text Predictions: On
* Accessibi
Type here to search
Expert Solution
Chart
a.
For the given data the following chart is appropriate.

Step by step
Solved in 2 steps with 1 images

Recommended textbooks for you
MATLAB: An Introduction with Applications
Statistics
ISBN:
9781119256830
Author:
Amos Gilat
Publisher:
John Wiley & Sons Inc

Probability and Statistics for Engineering and th…
Statistics
ISBN:
9781305251809
Author:
Jay L. Devore
Publisher:
Cengage Learning

Statistics for The Behavioral Sciences (MindTap C…
Statistics
ISBN:
9781305504912
Author:
Frederick J Gravetter, Larry B. Wallnau
Publisher:
Cengage Learning
MATLAB: An Introduction with Applications
Statistics
ISBN:
9781119256830
Author:
Amos Gilat
Publisher:
John Wiley & Sons Inc
Probability and Statistics for Engineering and th…
Statistics
ISBN:
9781305251809
Author:
Jay L. Devore
Publisher:
Cengage Learning
Statistics for The Behavioral Sciences (MindTap C…
Statistics
ISBN:
9781305504912
Author:
Frederick J Gravetter, Larry B. Wallnau
Publisher:
Cengage Learning

Elementary Statistics: Picturing the World (7th E…
Statistics
ISBN:
9780134683416
Author:
Ron Larson, Betsy Farber
Publisher:
PEARSON

The Basic Practice of Statistics
Statistics
ISBN:
9781319042578
Author:
David S. Moore, William I. Notz, Michael A. Fligner
Publisher:
W. H. Freeman

Introduction to the Practice of Statistics
Statistics
ISBN:
9781319013387
Author:
David S. Moore, George P. McCabe, Bruce A. Craig
Publisher:
W. H. Freeman