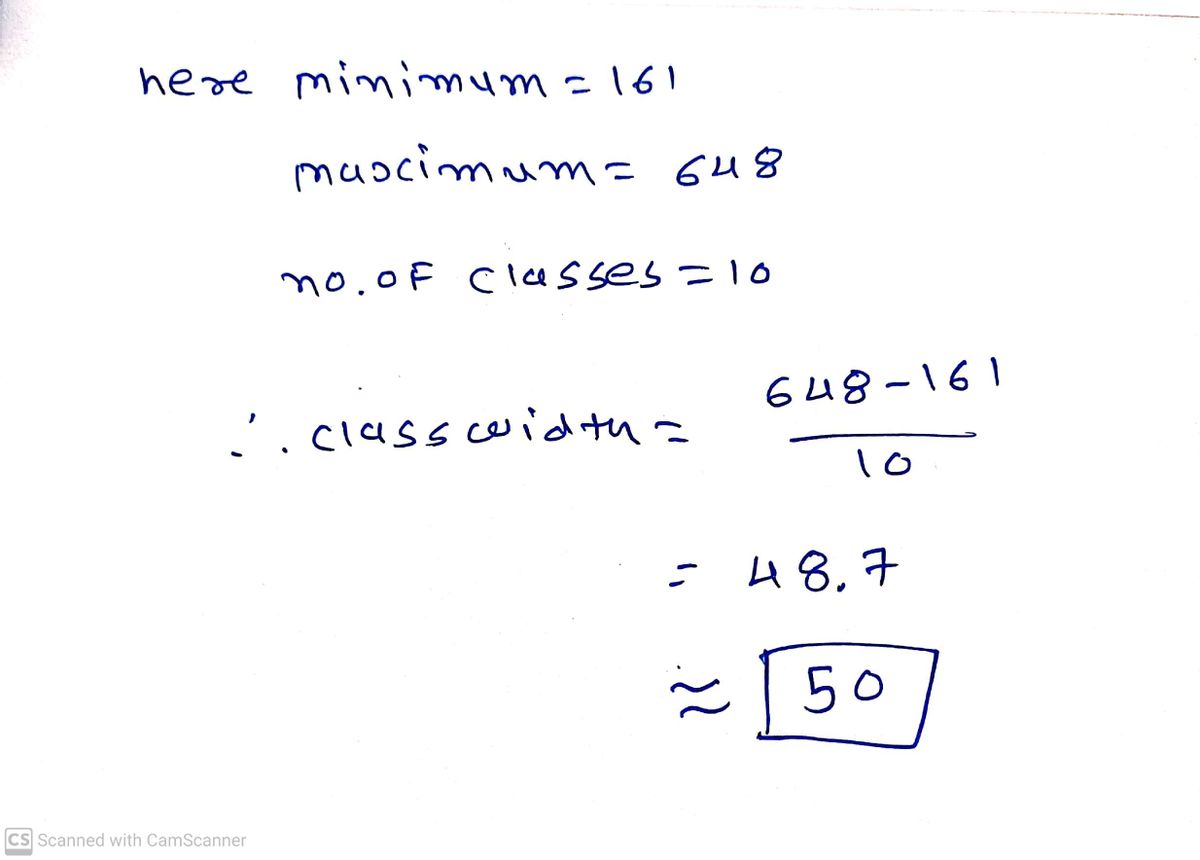
Here is a data set: 161 161 256 271 287 291 294 315 332 332 364 391 392 396 397 403 414 436 492 494 494 497 501 516 572 608 636 648 Construct a frequency distribution table for this data set. • Number of classes: 10 • Use a "nice" class width, such as a multiple of 5 or 10. • Label classes using interval notation. o For example, if the class is 70-79, label it as [70,79]. • The lower class limit should be a multiple of the class width. • For example, if the class width is 10, the lower class limit should be a number like 30 or 40 (depending on the data). Data range Frequency [160,209] 2 [210,259] 1 [260,309] 4 [310,359] 3 |[360,409] [410,459] 2 [460,509] [510,559] [560,609 ] 2 [610,659] 2
Here is a data set: 161 161 256 271 287 291 294 315 332 332 364 391 392 396 397 403 414 436 492 494 494 497 501 516 572 608 636 648 Construct a frequency distribution table for this data set. • Number of classes: 10 • Use a "nice" class width, such as a multiple of 5 or 10. • Label classes using interval notation. o For example, if the class is 70-79, label it as [70,79]. • The lower class limit should be a multiple of the class width. • For example, if the class width is 10, the lower class limit should be a number like 30 or 40 (depending on the data). Data range Frequency [160,209] 2 [210,259] 1 [260,309] 4 [310,359] 3 |[360,409] [410,459] 2 [460,509] [510,559] [560,609 ] 2 [610,659] 2

MATLAB: An Introduction with Applications
6th Edition
ISBN:9781119256830
Author:Amos Gilat
Publisher:Amos Gilat
Chapter1: Starting With Matlab
Section: Chapter Questions
Problem 1P

Related questions
Topic Video
Question
100%
Help Please!
![Here is a data set:
161
161
256
271
287
291
294
315
332
332
364
391
392
396
397
403
414
436
492
494
494
497
501
516
572
608
636
648
Construct a frequency distribution table for this data set.
• Number of classes: 10
• Use a "nice" class width, such as a multiple of 5 or 10.
• Label classes using interval notation.
o For example, if the class is 70-79, label it as [70,79].
• The lower class limit should be a multiple of the class width.
• For example, if the class width is 10, the lower class limit should be a number like 30 or 40
(depending on the data).
Data range
Frequency
[160,209]
2
[210,259]
1
[260,309]
4
[310,359]
3
|[360,409]
[410,459]
2
[460,509]
[510,559]
[560,609 ]
2
[610,659]
2](/v2/_next/image?url=https%3A%2F%2Fcontent.bartleby.com%2Fqna-images%2Fquestion%2Fc5905bff-4471-484e-82dc-738aa00ed6b1%2F6cb3f897-794f-4bab-b439-542e772fc4e0%2Fjesb2k_processed.png&w=3840&q=75)
Transcribed Image Text:Here is a data set:
161
161
256
271
287
291
294
315
332
332
364
391
392
396
397
403
414
436
492
494
494
497
501
516
572
608
636
648
Construct a frequency distribution table for this data set.
• Number of classes: 10
• Use a "nice" class width, such as a multiple of 5 or 10.
• Label classes using interval notation.
o For example, if the class is 70-79, label it as [70,79].
• The lower class limit should be a multiple of the class width.
• For example, if the class width is 10, the lower class limit should be a number like 30 or 40
(depending on the data).
Data range
Frequency
[160,209]
2
[210,259]
1
[260,309]
4
[310,359]
3
|[360,409]
[410,459]
2
[460,509]
[510,559]
[560,609 ]
2
[610,659]
2
Expert Solution
Step 1

Trending now
This is a popular solution!

Step by step
Solved in 2 steps with 2 images

Knowledge Booster


Learn more about
Need a deep-dive on the concept behind this application? Look no further. Learn more about this topic, statistics and related others by exploring similar questions and additional content below.Recommended textbooks for you
MATLAB: An Introduction with Applications
Statistics
ISBN:
9781119256830
Author:
Amos Gilat
Publisher:
John Wiley & Sons Inc

Probability and Statistics for Engineering and th…
Statistics
ISBN:
9781305251809
Author:
Jay L. Devore
Publisher:
Cengage Learning

Statistics for The Behavioral Sciences (MindTap C…
Statistics
ISBN:
9781305504912
Author:
Frederick J Gravetter, Larry B. Wallnau
Publisher:
Cengage Learning
MATLAB: An Introduction with Applications
Statistics
ISBN:
9781119256830
Author:
Amos Gilat
Publisher:
John Wiley & Sons Inc
Probability and Statistics for Engineering and th…
Statistics
ISBN:
9781305251809
Author:
Jay L. Devore
Publisher:
Cengage Learning
Statistics for The Behavioral Sciences (MindTap C…
Statistics
ISBN:
9781305504912
Author:
Frederick J Gravetter, Larry B. Wallnau
Publisher:
Cengage Learning

Elementary Statistics: Picturing the World (7th E…
Statistics
ISBN:
9780134683416
Author:
Ron Larson, Betsy Farber
Publisher:
PEARSON

The Basic Practice of Statistics
Statistics
ISBN:
9781319042578
Author:
David S. Moore, William I. Notz, Michael A. Fligner
Publisher:
W. H. Freeman

Introduction to the Practice of Statistics
Statistics
ISBN:
9781319013387
Author:
David S. Moore, George P. McCabe, Bruce A. Craig
Publisher:
W. H. Freeman