## Educational Resource: Analyzing Floor Space and Weekly Sales ### Data Table: The table below shows the relationship between store floor space (in square feet) and weekly sales (in dollars): | Floor Space (sq. ft.) | Weekly Sales (dollars) | |-----------------------|------------------------| | 5,060 | 16,380 | | 5,230 | 14,400 | | 4,280 | 13,820 | | 3,580 | 18,320 | | 5,670 | 14,200 | | 4,500 | 12,390 | | 5,410 | 15,846 | | 4,296 | 11,810 | | 4,220 | 13,610 | | 4,320 | 10,650 | | 4,878 | 15,320 | | 5,470 | 13,270 | [Click here for the Excel Data File] ### Scatter Plots: Using the table above, select the most appropriate scatter plot from the given choices: #### Scatter Plot A: - **Title:** Floor Space and Weekly Sales - **Horizontal Axis:** Floor Space (ranging from 1,000 to 7,000 sq. ft.) - **Vertical Axis:** Weekly Sales (ranging from $0 to $20,000) - **Data Points:** Display a slight positive trend between floor space and weekly sales, indicating that larger floor spaces tend to have higher weekly sales. #### Scatter Plot B: - **Title:** Floor Space and Weekly Sales - **Horizontal Axis:** Floor Space (ranging from 1,000 to 7,000 sq. ft.) - **Vertical Axis:** Weekly Sales (ranging from $0 to $20,000) - **Data Points:** Show a more scattered and random distribution, suggesting no clear correlation between floor space and weekly sales. ### Instruction: Based on the data table, evaluate which scatter plot (A or B) best represents the relationship between floor space and weekly sales. Consider the trend and distribution of the data points when making your selection. The image shows two graphs titled "Floor Space and Weekly Sales." Each graph plots data points with "Floor Space" on the x-axis and "Weekly Sales" on the y-axis. The first graph shows floor space values from 1,000 to 7,000 square feet, with corresponding weekly sales between $4,000 and $20,000. Data points are distributed across the graph, indicating a potential trend between these two variables. The second graph also charts floor space versus weekly sales over the same range but may include different data distributions, allowing comparisons or showing trends within a similar dataset. Below these graphs, there's instructional text: "Select more than one answer. Click the box with a check mark for the correct answer." The page view indicates this is page 7 of 19 in a sequence, suggesting a part of a larger educational module.
## Educational Resource: Analyzing Floor Space and Weekly Sales ### Data Table: The table below shows the relationship between store floor space (in square feet) and weekly sales (in dollars): | Floor Space (sq. ft.) | Weekly Sales (dollars) | |-----------------------|------------------------| | 5,060 | 16,380 | | 5,230 | 14,400 | | 4,280 | 13,820 | | 3,580 | 18,320 | | 5,670 | 14,200 | | 4,500 | 12,390 | | 5,410 | 15,846 | | 4,296 | 11,810 | | 4,220 | 13,610 | | 4,320 | 10,650 | | 4,878 | 15,320 | | 5,470 | 13,270 | [Click here for the Excel Data File] ### Scatter Plots: Using the table above, select the most appropriate scatter plot from the given choices: #### Scatter Plot A: - **Title:** Floor Space and Weekly Sales - **Horizontal Axis:** Floor Space (ranging from 1,000 to 7,000 sq. ft.) - **Vertical Axis:** Weekly Sales (ranging from $0 to $20,000) - **Data Points:** Display a slight positive trend between floor space and weekly sales, indicating that larger floor spaces tend to have higher weekly sales. #### Scatter Plot B: - **Title:** Floor Space and Weekly Sales - **Horizontal Axis:** Floor Space (ranging from 1,000 to 7,000 sq. ft.) - **Vertical Axis:** Weekly Sales (ranging from $0 to $20,000) - **Data Points:** Show a more scattered and random distribution, suggesting no clear correlation between floor space and weekly sales. ### Instruction: Based on the data table, evaluate which scatter plot (A or B) best represents the relationship between floor space and weekly sales. Consider the trend and distribution of the data points when making your selection. The image shows two graphs titled "Floor Space and Weekly Sales." Each graph plots data points with "Floor Space" on the x-axis and "Weekly Sales" on the y-axis. The first graph shows floor space values from 1,000 to 7,000 square feet, with corresponding weekly sales between $4,000 and $20,000. Data points are distributed across the graph, indicating a potential trend between these two variables. The second graph also charts floor space versus weekly sales over the same range but may include different data distributions, allowing comparisons or showing trends within a similar dataset. Below these graphs, there's instructional text: "Select more than one answer. Click the box with a check mark for the correct answer." The page view indicates this is page 7 of 19 in a sequence, suggesting a part of a larger educational module.

MATLAB: An Introduction with Applications
6th Edition
ISBN:9781119256830
Author:Amos Gilat
Publisher:Amos Gilat
Chapter1: Starting With Matlab
Section: Chapter Questions
Problem 1P

Related questions
Question
![## Educational Resource: Analyzing Floor Space and Weekly Sales
### Data Table:
The table below shows the relationship between store floor space (in square feet) and weekly sales (in dollars):
| Floor Space (sq. ft.) | Weekly Sales (dollars) |
|-----------------------|------------------------|
| 5,060 | 16,380 |
| 5,230 | 14,400 |
| 4,280 | 13,820 |
| 3,580 | 18,320 |
| 5,670 | 14,200 |
| 4,500 | 12,390 |
| 5,410 | 15,846 |
| 4,296 | 11,810 |
| 4,220 | 13,610 |
| 4,320 | 10,650 |
| 4,878 | 15,320 |
| 5,470 | 13,270 |
[Click here for the Excel Data File]
### Scatter Plots:
Using the table above, select the most appropriate scatter plot from the given choices:
#### Scatter Plot A:
- **Title:** Floor Space and Weekly Sales
- **Horizontal Axis:** Floor Space (ranging from 1,000 to 7,000 sq. ft.)
- **Vertical Axis:** Weekly Sales (ranging from $0 to $20,000)
- **Data Points:** Display a slight positive trend between floor space and weekly sales, indicating that larger floor spaces tend to have higher weekly sales.
#### Scatter Plot B:
- **Title:** Floor Space and Weekly Sales
- **Horizontal Axis:** Floor Space (ranging from 1,000 to 7,000 sq. ft.)
- **Vertical Axis:** Weekly Sales (ranging from $0 to $20,000)
- **Data Points:** Show a more scattered and random distribution, suggesting no clear correlation between floor space and weekly sales.
### Instruction:
Based on the data table, evaluate which scatter plot (A or B) best represents the relationship between floor space and weekly sales. Consider the trend and distribution of the data points when making your selection.](/v2/_next/image?url=https%3A%2F%2Fcontent.bartleby.com%2Fqna-images%2Fquestion%2F39854b56-32f5-4283-a392-c69ce5f90130%2F6131c96a-27cd-4c31-848a-d938eff00136%2Fwa3uf7.jpeg&w=3840&q=75)
Transcribed Image Text:## Educational Resource: Analyzing Floor Space and Weekly Sales
### Data Table:
The table below shows the relationship between store floor space (in square feet) and weekly sales (in dollars):
| Floor Space (sq. ft.) | Weekly Sales (dollars) |
|-----------------------|------------------------|
| 5,060 | 16,380 |
| 5,230 | 14,400 |
| 4,280 | 13,820 |
| 3,580 | 18,320 |
| 5,670 | 14,200 |
| 4,500 | 12,390 |
| 5,410 | 15,846 |
| 4,296 | 11,810 |
| 4,220 | 13,610 |
| 4,320 | 10,650 |
| 4,878 | 15,320 |
| 5,470 | 13,270 |
[Click here for the Excel Data File]
### Scatter Plots:
Using the table above, select the most appropriate scatter plot from the given choices:
#### Scatter Plot A:
- **Title:** Floor Space and Weekly Sales
- **Horizontal Axis:** Floor Space (ranging from 1,000 to 7,000 sq. ft.)
- **Vertical Axis:** Weekly Sales (ranging from $0 to $20,000)
- **Data Points:** Display a slight positive trend between floor space and weekly sales, indicating that larger floor spaces tend to have higher weekly sales.
#### Scatter Plot B:
- **Title:** Floor Space and Weekly Sales
- **Horizontal Axis:** Floor Space (ranging from 1,000 to 7,000 sq. ft.)
- **Vertical Axis:** Weekly Sales (ranging from $0 to $20,000)
- **Data Points:** Show a more scattered and random distribution, suggesting no clear correlation between floor space and weekly sales.
### Instruction:
Based on the data table, evaluate which scatter plot (A or B) best represents the relationship between floor space and weekly sales. Consider the trend and distribution of the data points when making your selection.

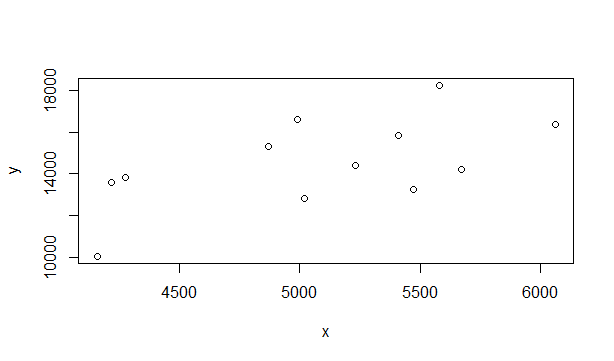
Transcribed Image Text:The image shows two graphs titled "Floor Space and Weekly Sales." Each graph plots data points with "Floor Space" on the x-axis and "Weekly Sales" on the y-axis.
The first graph shows floor space values from 1,000 to 7,000 square feet, with corresponding weekly sales between $4,000 and $20,000. Data points are distributed across the graph, indicating a potential trend between these two variables.
The second graph also charts floor space versus weekly sales over the same range but may include different data distributions, allowing comparisons or showing trends within a similar dataset.
Below these graphs, there's instructional text: "Select more than one answer. Click the box with a check mark for the correct answer."
The page view indicates this is page 7 of 19 in a sequence, suggesting a part of a larger educational module.
Expert Solution
Step 1
The scatter plot for given data points is:

Step by step
Solved in 2 steps with 1 images

Recommended textbooks for you
MATLAB: An Introduction with Applications
Statistics
ISBN:
9781119256830
Author:
Amos Gilat
Publisher:
John Wiley & Sons Inc

Probability and Statistics for Engineering and th…
Statistics
ISBN:
9781305251809
Author:
Jay L. Devore
Publisher:
Cengage Learning

Statistics for The Behavioral Sciences (MindTap C…
Statistics
ISBN:
9781305504912
Author:
Frederick J Gravetter, Larry B. Wallnau
Publisher:
Cengage Learning
MATLAB: An Introduction with Applications
Statistics
ISBN:
9781119256830
Author:
Amos Gilat
Publisher:
John Wiley & Sons Inc
Probability and Statistics for Engineering and th…
Statistics
ISBN:
9781305251809
Author:
Jay L. Devore
Publisher:
Cengage Learning
Statistics for The Behavioral Sciences (MindTap C…
Statistics
ISBN:
9781305504912
Author:
Frederick J Gravetter, Larry B. Wallnau
Publisher:
Cengage Learning

Elementary Statistics: Picturing the World (7th E…
Statistics
ISBN:
9780134683416
Author:
Ron Larson, Betsy Farber
Publisher:
PEARSON

The Basic Practice of Statistics
Statistics
ISBN:
9781319042578
Author:
David S. Moore, William I. Notz, Michael A. Fligner
Publisher:
W. H. Freeman

Introduction to the Practice of Statistics
Statistics
ISBN:
9781319013387
Author:
David S. Moore, George P. McCabe, Bruce A. Craig
Publisher:
W. H. Freeman