Investment advertisements always warn that "past performance does not guarantee future results." An example that shows why you should pay attention to this warning is given. Stocks fell sharply in 2002, then rose sharply in 2003. The table gives the percentage returns from 2323 Fidelity Investments "sector funds" in these two years. Sector funds invest in narrow segments of the stock market. They often rise and fall faster than the market as a whole. 2002 Return 2003 Return −17.1 23.9 −6.7 14.1 −21.1 41.8 −12.8 43.9 −18.9 31.1 −7.7 32.3 −17.2 36.5 −11.4 30.6 −0.7 36.9 −5.6 27.5 −26.9 26.1 −42.0 62.7 −47.8 68.1 −50.5 71.9 −49.5 57.0 −23.4 35.0 −37.8 59.4 −11.5 22.9 −0.7 36.9 64.36 32.1 −9.6 28.7 −11.7 29.5 −2.3 19.1 Make a scatterplot of the 2003 return (response) against 2002 return (explanatory)


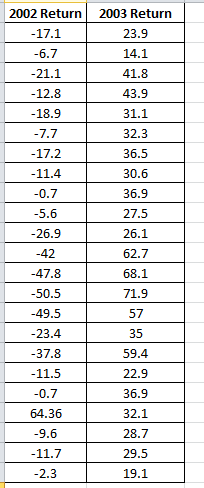
Investment advertisements always warn that "past performance does not guarantee future results." An example that shows why you should pay attention to this warning is given. Stocks fell sharply in 2002, then rose sharply in 2003. The table gives the percentage returns from 2323 Fidelity Investments "sector funds" in these two years. Sector funds invest in narrow segments of the stock market. They often rise and fall faster than the market as a whole.
| 2002 Return | 2003 Return |
|---|---|
| −17.1 | 23.9 |
| −6.7 | 14.1 |
| −21.1 | 41.8 |
| −12.8 | 43.9 |
| −18.9 | 31.1 |
| −7.7 | 32.3 |
| −17.2 | 36.5 |
| −11.4 | 30.6 |
| −0.7 | 36.9 |
| −5.6 | 27.5 |
| −26.9 | 26.1 |
| −42.0 | 62.7 |
| −47.8 | 68.1 |
| −50.5 | 71.9 |
| −49.5 | 57.0 |
| −23.4 | 35.0 |
| −37.8 | 59.4 |
| −11.5 | 22.9 |
| −0.7 | 36.9 |
| 64.36 | 32.1 |
| −9.6 | 28.7 |
| −11.7 | 29.5 |
| −2.3 | 19.1 |
Make a scatterplot of the 2003 return (response) against 2002 return (explanatory)
The question is about graphical representation
Given :
To find :
Construct scatter plot

Trending now
This is a popular solution!

Step by step
Solved in 2 steps with 2 images

find the equations of two least‑squares lines for predicting 2003 return from 2002 return, one for all 2323 funds and one omitting the Fidelity Gold Fund. Add both lines to your scatterplot.


