Calculus: Early Transcendentals
8th Edition
ISBN:9781285741550
Author:James Stewart
Publisher:James Stewart
Chapter1: Functions And Models
Section: Chapter Questions
Problem 1RCC: (a) What is a function? What are its domain and range? (b) What is the graph of a function? (c) How...
Related questions
Question
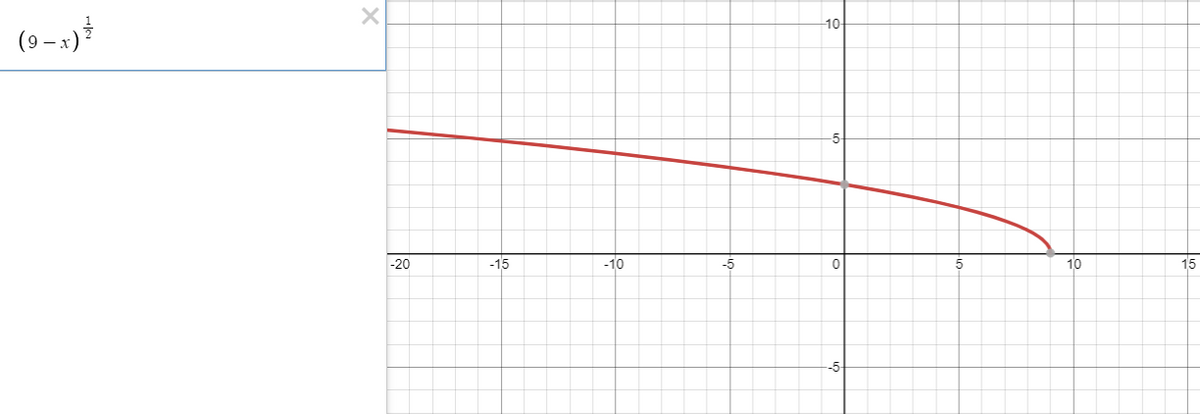
Can you please explain to me the highlighted graph in the attached photo - why is it graphed that way? Please be detailed.
![The image shows instructional text and a graph related to solving an equation. Here's the transcription as it might appear on an educational website:
---
**Equation Solving Example:**
To solve for \( y \), take the square root of both sides of the equation:
\[ f^{-1}(x) = \sqrt{x} + 9, x < 9 \]
*Note: You can tap to view steps on an interactive interface.*
**Graph Explanation:**
The graph displays a curved line, which appears to represent a mathematical function. The x-axis and y-axis are present, with numerical markings at intervals (e.g., 10, 20). The curve starts from the top, moves downward, and bends toward the horizontal axis. A part of the graph is highlighted in yellow, possibly indicating a specific portion or feature of interest. This might relate to the limited domain \( x < 9 \).
*You may have interactive options to show or hide the graph for better visibility of its elements.*
---](/v2/_next/image?url=https%3A%2F%2Fcontent.bartleby.com%2Fqna-images%2Fquestion%2Fea000c69-b4f2-413a-9977-6a5d2d2ee8af%2F5acb4511-cb6c-43aa-b80f-b4c6b04d6fd0%2F8d9hkvq_processed.jpeg&w=3840&q=75)
Transcribed Image Text:The image shows instructional text and a graph related to solving an equation. Here's the transcription as it might appear on an educational website:
---
**Equation Solving Example:**
To solve for \( y \), take the square root of both sides of the equation:
\[ f^{-1}(x) = \sqrt{x} + 9, x < 9 \]
*Note: You can tap to view steps on an interactive interface.*
**Graph Explanation:**
The graph displays a curved line, which appears to represent a mathematical function. The x-axis and y-axis are present, with numerical markings at intervals (e.g., 10, 20). The curve starts from the top, moves downward, and bends toward the horizontal axis. A part of the graph is highlighted in yellow, possibly indicating a specific portion or feature of interest. This might relate to the limited domain \( x < 9 \).
*You may have interactive options to show or hide the graph for better visibility of its elements.*
---
Expert Solution
Explanation
The highlighted graph is here the actual graph of the given equation. Where as other blue colour marked graph is the inverse of the actual given inverse function.

The above attached graph of f-1(x)=(-x+9)1/2 is drawn for your reference.
Trending now
This is a popular solution!
Step by step
Solved in 2 steps with 1 images

Knowledge Booster
Learn more about
Need a deep-dive on the concept behind this application? Look no further. Learn more about this topic, calculus and related others by exploring similar questions and additional content below.Recommended textbooks for you

Calculus: Early Transcendentals
Calculus
ISBN:
9781285741550
Author:
James Stewart
Publisher:
Cengage Learning

Thomas' Calculus (14th Edition)
Calculus
ISBN:
9780134438986
Author:
Joel R. Hass, Christopher E. Heil, Maurice D. Weir
Publisher:
PEARSON

Calculus: Early Transcendentals (3rd Edition)
Calculus
ISBN:
9780134763644
Author:
William L. Briggs, Lyle Cochran, Bernard Gillett, Eric Schulz
Publisher:
PEARSON

Calculus: Early Transcendentals
Calculus
ISBN:
9781285741550
Author:
James Stewart
Publisher:
Cengage Learning

Thomas' Calculus (14th Edition)
Calculus
ISBN:
9780134438986
Author:
Joel R. Hass, Christopher E. Heil, Maurice D. Weir
Publisher:
PEARSON

Calculus: Early Transcendentals (3rd Edition)
Calculus
ISBN:
9780134763644
Author:
William L. Briggs, Lyle Cochran, Bernard Gillett, Eric Schulz
Publisher:
PEARSON

Calculus: Early Transcendentals
Calculus
ISBN:
9781319050740
Author:
Jon Rogawski, Colin Adams, Robert Franzosa
Publisher:
W. H. Freeman


Calculus: Early Transcendental Functions
Calculus
ISBN:
9781337552516
Author:
Ron Larson, Bruce H. Edwards
Publisher:
Cengage Learning