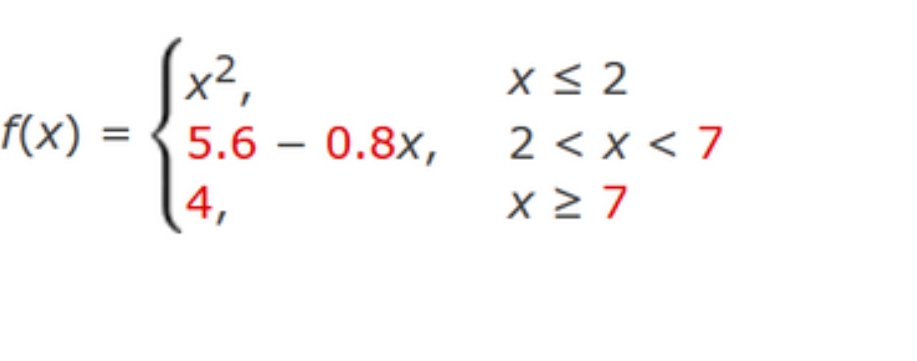
Sketch the graph of f. Then identify the values of c for which lim f(x) exists. X →→ C f(x) = (x², 5.6 - 0.8x, 4, Step 1 To sketch the graph of f, first consider f(x) = x² for x ≤ 2 by constructing a table of values. X f(x) X 3 f(x) 3.2 -2 x ≤ 2 2
Sketch the graph of f. Then identify the values of c for which lim f(x) exists. X →→ C f(x) = (x², 5.6 - 0.8x, 4, Step 1 To sketch the graph of f, first consider f(x) = x² for x ≤ 2 by constructing a table of values. X f(x) X 3 f(x) 3.2 -2 x ≤ 2 2
Calculus: Early Transcendentals
8th Edition
ISBN:9781285741550
Author:James Stewart
Publisher:James Stewart
Chapter1: Functions And Models
Section: Chapter Questions
Problem 1RCC: (a) What is a function? What are its domain and range? (b) What is the graph of a function? (c) How...
Related questions
Question

Transcribed Image Text:Sketch the graph of f. Then identify the values of c for which lim_f(x) exists.
X →→ C
f(x)
(x²,
= 5.6 - 0.8x,
4,
Step 1
To sketch the graph of f, first consider f(x) = x² for x ≤ 2 by constructing a table of values.
X
f(x)
X 3
f(x) 3.2
-2
X
X ≤ 2
2<x< 7
X ≥ 7
f(x)
4
Step 2
Now, construct a table of values for f(x)
2.4
-1
1
7
4
0
Submit Skip (you cannot come back)
2.4
=
0
7.5
4
1
4.5
5.6 - 0.8x for 2 < x < 7 by substituting values of x in the definition of f(x).
2
Step 3
Finally, consider f(x) = 4 for x ≥ 7. Construct a table of values by substituting values of x in the definition for f(x).
2 1.6
8
5
1.6
8.5
4
0.8
9
Expert Solution
Step 1: Given
We have given,

Step by step
Solved in 5 steps with 5 images

Follow-up Questions
Read through expert solutions to related follow-up questions below.
Follow-up Question

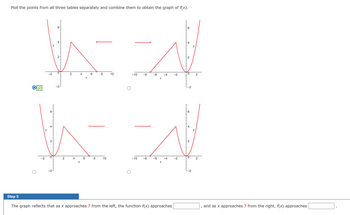
Transcribed Image Text:Plot the points from all three tables separately and combine them to obtain the graph of f(x).
8
10
-10
WW
WW
10
-10
A
6
2
2
4
X
6
6
8
-8
-8
Step 5
The graph reflects that as x approaches 7 from the left, the function f(x) approaches
-2
0
0
2
2
and as x approaches 7 from the right, f(x) approaches
Solution
Recommended textbooks for you

Calculus: Early Transcendentals
Calculus
ISBN:
9781285741550
Author:
James Stewart
Publisher:
Cengage Learning

Thomas' Calculus (14th Edition)
Calculus
ISBN:
9780134438986
Author:
Joel R. Hass, Christopher E. Heil, Maurice D. Weir
Publisher:
PEARSON

Calculus: Early Transcendentals (3rd Edition)
Calculus
ISBN:
9780134763644
Author:
William L. Briggs, Lyle Cochran, Bernard Gillett, Eric Schulz
Publisher:
PEARSON

Calculus: Early Transcendentals
Calculus
ISBN:
9781285741550
Author:
James Stewart
Publisher:
Cengage Learning

Thomas' Calculus (14th Edition)
Calculus
ISBN:
9780134438986
Author:
Joel R. Hass, Christopher E. Heil, Maurice D. Weir
Publisher:
PEARSON

Calculus: Early Transcendentals (3rd Edition)
Calculus
ISBN:
9780134763644
Author:
William L. Briggs, Lyle Cochran, Bernard Gillett, Eric Schulz
Publisher:
PEARSON

Calculus: Early Transcendentals
Calculus
ISBN:
9781319050740
Author:
Jon Rogawski, Colin Adams, Robert Franzosa
Publisher:
W. H. Freeman


Calculus: Early Transcendental Functions
Calculus
ISBN:
9781337552516
Author:
Ron Larson, Bruce H. Edwards
Publisher:
Cengage Learning