Algebra & Trigonometry with Analytic Geometry
13th Edition
ISBN:9781133382119
Author:Swokowski
Publisher:Swokowski
Chapter3: Functions And Graphs
Section3.2: Graphs Of Equations
Problem 15E
Related questions
Question
![### Plotting a Linear Equation
#### Task:
Sketch a graph of the linear equation:
\[ y = -2x + 2 \]
#### Explanation of the Graph:
The provided graph is a coordinate plane with both x and y axes. The x-axis (horizontal) and y-axis (vertical) are labeled with numbers from -5 to 5. The graph has a grid with each line representing a single unit.
##### Steps to Plot the Equation:
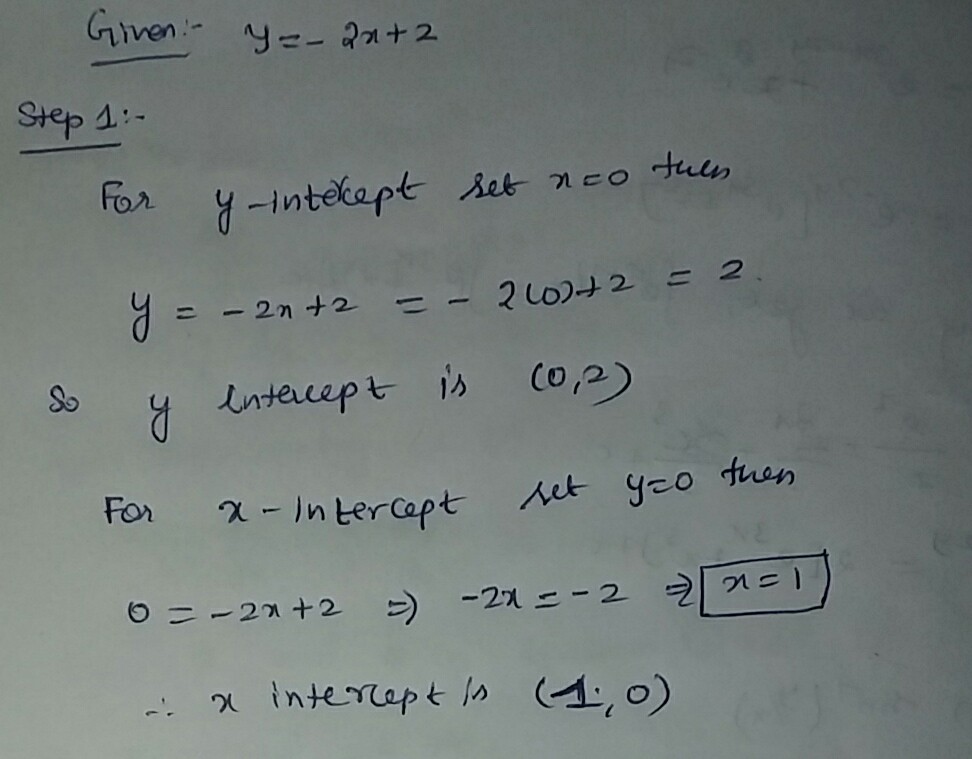
1. **Find the y-intercept**:
- The y-intercept is the point where the line crosses the y-axis.
- For the equation \( y = -2x + 2 \), the y-intercept is 2. Plot this point on the y-axis at (0, 2).
2. **Use the Slope**:
- The slope of the line is -2, which means for every 1 unit you move to the right on the x-axis, you move 2 units down on the y-axis.
- From the y-intercept (0, 2), move 1 unit to the right (to x = 1) and 2 units down (to y = 0), arriving at the point (1, 0). Plot this point.
3. **Draw the Line**:
- Connect the points (0, 2) and (1, 0) with a straight line.
- Extend the line in both directions, maintaining the slope of -2, to complete the graph of the equation.
This visual representation aids in understanding the relationship between the variables x and y as defined by the equation \( y = -2x + 2 \). The negative slope indicates that as x increases, y decreases.](/v2/_next/image?url=https%3A%2F%2Fcontent.bartleby.com%2Fqna-images%2Fquestion%2F99db74cb-a52b-4540-9e19-530fc4ba7537%2F802e9836-cdcd-47f7-8512-8de2b62cba43%2Fmnz01so_processed.png&w=3840&q=75)
Transcribed Image Text:### Plotting a Linear Equation
#### Task:
Sketch a graph of the linear equation:
\[ y = -2x + 2 \]
#### Explanation of the Graph:
The provided graph is a coordinate plane with both x and y axes. The x-axis (horizontal) and y-axis (vertical) are labeled with numbers from -5 to 5. The graph has a grid with each line representing a single unit.
##### Steps to Plot the Equation:
1. **Find the y-intercept**:
- The y-intercept is the point where the line crosses the y-axis.
- For the equation \( y = -2x + 2 \), the y-intercept is 2. Plot this point on the y-axis at (0, 2).
2. **Use the Slope**:
- The slope of the line is -2, which means for every 1 unit you move to the right on the x-axis, you move 2 units down on the y-axis.
- From the y-intercept (0, 2), move 1 unit to the right (to x = 1) and 2 units down (to y = 0), arriving at the point (1, 0). Plot this point.
3. **Draw the Line**:
- Connect the points (0, 2) and (1, 0) with a straight line.
- Extend the line in both directions, maintaining the slope of -2, to complete the graph of the equation.
This visual representation aids in understanding the relationship between the variables x and y as defined by the equation \( y = -2x + 2 \). The negative slope indicates that as x increases, y decreases.
Expert Solution
Step 1

Step by step
Solved in 2 steps with 2 images

Recommended textbooks for you

Algebra & Trigonometry with Analytic Geometry
Algebra
ISBN:
9781133382119
Author:
Swokowski
Publisher:
Cengage

Intermediate Algebra
Algebra
ISBN:
9781285195728
Author:
Jerome E. Kaufmann, Karen L. Schwitters
Publisher:
Cengage Learning

Algebra for College Students
Algebra
ISBN:
9781285195780
Author:
Jerome E. Kaufmann, Karen L. Schwitters
Publisher:
Cengage Learning

Algebra & Trigonometry with Analytic Geometry
Algebra
ISBN:
9781133382119
Author:
Swokowski
Publisher:
Cengage

Intermediate Algebra
Algebra
ISBN:
9781285195728
Author:
Jerome E. Kaufmann, Karen L. Schwitters
Publisher:
Cengage Learning

Algebra for College Students
Algebra
ISBN:
9781285195780
Author:
Jerome E. Kaufmann, Karen L. Schwitters
Publisher:
Cengage Learning

Algebra: Structure And Method, Book 1
Algebra
ISBN:
9780395977224
Author:
Richard G. Brown, Mary P. Dolciani, Robert H. Sorgenfrey, William L. Cole
Publisher:
McDougal Littell

Elementary Algebra
Algebra
ISBN:
9780998625713
Author:
Lynn Marecek, MaryAnne Anthony-Smith
Publisher:
OpenStax - Rice University

College Algebra (MindTap Course List)
Algebra
ISBN:
9781305652231
Author:
R. David Gustafson, Jeff Hughes
Publisher:
Cengage Learning