Sinusoidal Wire A wire segment is bent into a sinusoidal shape with period of 2, which gives magnetic field in the vicinity of the wire which points in the positive z-direction y 0.5+ 0.5 fy- =sin(x) and the wire has length of 27 in the x-direction. The wire is carrying a current of 4.5 A in the direction shown in the figure. There is a with a magnitude given by B = Box, where Bo = 18.1 T/m. What is the y-component of the force on the wire segment?
Sinusoidal Wire A wire segment is bent into a sinusoidal shape with period of 2, which gives magnetic field in the vicinity of the wire which points in the positive z-direction y 0.5+ 0.5 fy- =sin(x) and the wire has length of 27 in the x-direction. The wire is carrying a current of 4.5 A in the direction shown in the figure. There is a with a magnitude given by B = Box, where Bo = 18.1 T/m. What is the y-component of the force on the wire segment?

Related questions
Question
I am not really sure how to approach this problem what would be the best way to do this?

Transcribed Image Text:**Sinusoidal Wire**
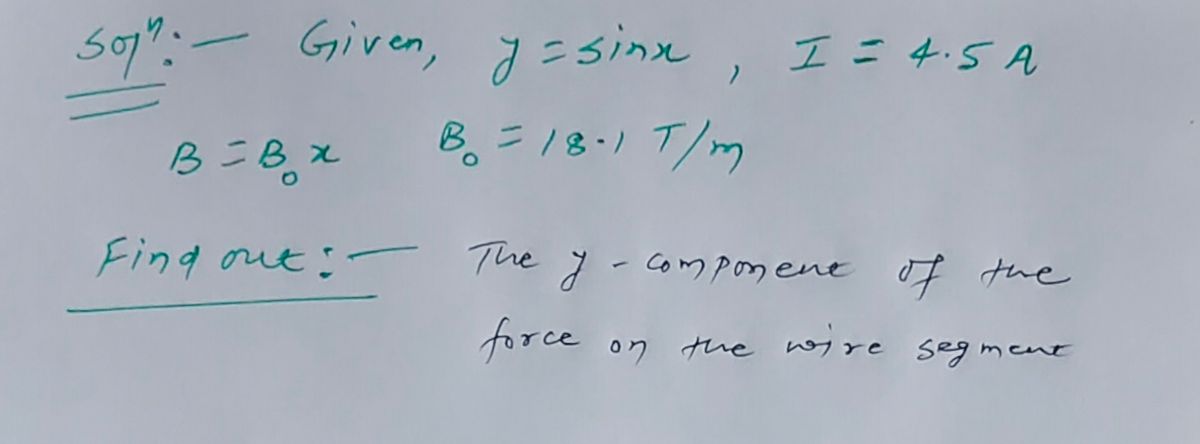
A wire segment is bent into a sinusoidal shape with a period of \(2\pi\), which gives \(y = \sin(x)\), and the wire has a length of \(2\pi\) in the \(x\)-direction. The wire is carrying a current of 4.5 A in the direction shown in the figure. There is a magnetic field in the vicinity of the wire which points in the positive \(z\)-direction with a magnitude given by \(B = B_0x\), where \(B_0 = 18.1 \, \text{T/m}\). What is the \(y\)-component of the force on the wire segment?
**Graph Explanation:**
The graph shows a sinusoidal curve representing the shape of the wire, following the equation \(y = \sin(x)\). The graph is plotted over one period, \(2\pi\), on the \(x\)-axis. The \(y\)-axis shows the sine values from -1 to 1.
The background of the graph contains a series of dots, each representing the direction and uniformity of the magnetic field. The field is plotted as a range of dots pointing in the positive \(z\)-direction, perpendicular to the plane of the graph.
Boxes labeled I and II highlight sections of the sinusoidal curve where calculations or specific observations might be concentrated.
A box below the graph marked \(f_y =\) allows for the input of calculations regarding the \(y\)-component of the force.
Expert Solution
Step 1

Step by step
Solved in 3 steps with 3 images
