Scores on a large standardized test are normally distributed with a national average score of 75. At a college, we have 16 students who take this test and get an average score of 76 with a standard deviation of 11. Use a significance level of 0.05. What is the Null Hypothesis? What is the Alternate Hypothesis? What is the Test Statistic?


Scores on a large standardized test are
What is the Null Hypothesis?
What is the Alternate Hypothesis?
What is the Test Statistic?
Given Information :
Scores on a large standardized test are normally distributed with a national average score of 75. At a college, we have 16 students who take this test and get an average score of 76 with a standard deviation of 11.
The provided sample mean is and the sample standard deviation is , and the sample size is .
Null and Alternative Hypotheses
The following null and alternative hypotheses need to be tested:
Ho: College average score is equal to national average score .
=
Ha: College average score is different than the national average score .
≠
This corresponds to a two-tailed test, for which a t-test for one mean, with unknown population standard deviation will be used.
Rejection Region
Based on the information provided, the significance level is , and the critical value for a two-tailed test is .
The rejection region for this two-tailed test is
Test Statistics
The t-statistic is computed as follows:
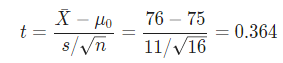
Test Statistic = 0.364

Step by step
Solved in 3 steps with 1 images


