Risk Ratio a. Table 1 b. Table 2 2. Odds Ratio a. Table 1 b. Table 2 3. Answer the following using the information calculated above: a. Discuss how the Risk Ratio compare to the odds
Risk Ratio a. Table 1 b. Table 2 2. Odds Ratio a. Table 1 b. Table 2 3. Answer the following using the information calculated above: a. Discuss how the Risk Ratio compare to the odds

MATLAB: An Introduction with Applications
6th Edition
ISBN:9781119256830
Author:Amos Gilat
Publisher:Amos Gilat
Chapter1: Starting With Matlab
Section: Chapter Questions
Problem 1P

Related questions
Question
1. Risk Ratio
a. Table 1
b. Table 2
2. Odds Ratio
a. Table 1
b. Table 2
3. Answer the following using the information calculated above:
a. Discuss how the Risk Ratio compare to the odds ratio for table 1.
b. Discuss how the risk ratio compare to the odds ratio for table 2.
c. Describe the reasons for the differences/simi

Transcribed Image Text:**Part 4: Relationship between Risk Ratio and Odds Ratios**
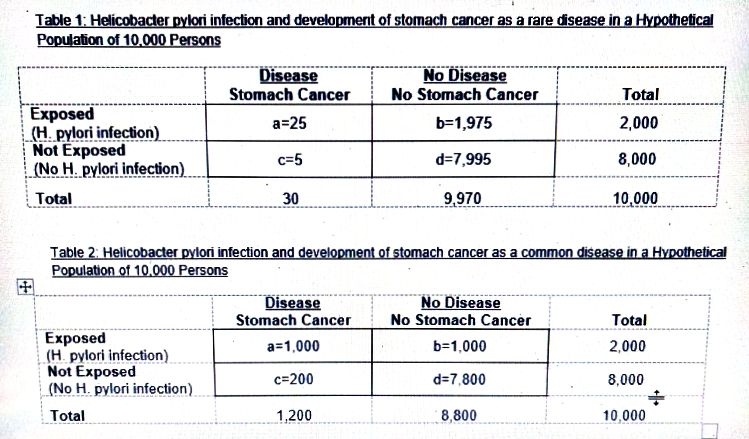
Use the data in Tables 1 and 2 to calculate the risk and odds ratios.
**Table 1: Helicobacter pylori infection and development of stomach cancer as a rare disease in a Hypothetical Population of 10,000 Persons**
| | Disease | | |
|-----------------|----------|-------------|--------------|
| | Stomach Cancer | No Stomach Cancer | Total |
| Exposed (H. pylori infection) | a = 25 | b = 1,975 | 2,000 |
| Not Exposed (No H. pylori infection) | c = 5 | d = 7,995 | 8,000 |
| Total | 30 | 9,970 | 10,000 |
**Table 2: Helicobacter pylori infection and development of stomach cancer as a common disease in a Hypothetical Population of 10,000 Persons**
| | Disease | | |
|-----------------|----------|-------------|--------------|
| | Stomach Cancer | No Stomach Cancer | Total |
| Exposed (H. pylori infection) | a = 1,000 | b = 1,000 | 2,000 |
| Not Exposed (No H. pylori infection) | c = 200 | d = 7,800 | 8,000 |
| Total | 1,200 | 8,800 | 10,000 |
1. **Risk Ratio**:
- **Table 1:**
- Risk in Exposed = a / (a + b) = 25 / 2,000
- Risk in Not Exposed = c / (c + d) = 5 / 8,000
- **Table 2:**
- Risk in Exposed = a / (a + b) = 1,000 / 2,000
- Risk in Not Exposed = c / (c + d) = 200 / 8,000
These tables illustrate the relationship between Helicobacter pylori infection and the development of stomach cancer, considering both rare and common disease scenarios in a hypothetical population of 10,000 persons.
Expert Solution
Step 1
* SOLUTION :-
Given that ,

Step by step
Solved in 8 steps with 3 images

Recommended textbooks for you
MATLAB: An Introduction with Applications
Statistics
ISBN:
9781119256830
Author:
Amos Gilat
Publisher:
John Wiley & Sons Inc

Probability and Statistics for Engineering and th…
Statistics
ISBN:
9781305251809
Author:
Jay L. Devore
Publisher:
Cengage Learning

Statistics for The Behavioral Sciences (MindTap C…
Statistics
ISBN:
9781305504912
Author:
Frederick J Gravetter, Larry B. Wallnau
Publisher:
Cengage Learning
MATLAB: An Introduction with Applications
Statistics
ISBN:
9781119256830
Author:
Amos Gilat
Publisher:
John Wiley & Sons Inc
Probability and Statistics for Engineering and th…
Statistics
ISBN:
9781305251809
Author:
Jay L. Devore
Publisher:
Cengage Learning
Statistics for The Behavioral Sciences (MindTap C…
Statistics
ISBN:
9781305504912
Author:
Frederick J Gravetter, Larry B. Wallnau
Publisher:
Cengage Learning

Elementary Statistics: Picturing the World (7th E…
Statistics
ISBN:
9780134683416
Author:
Ron Larson, Betsy Farber
Publisher:
PEARSON

The Basic Practice of Statistics
Statistics
ISBN:
9781319042578
Author:
David S. Moore, William I. Notz, Michael A. Fligner
Publisher:
W. H. Freeman

Introduction to the Practice of Statistics
Statistics
ISBN:
9781319013387
Author:
David S. Moore, George P. McCabe, Bruce A. Craig
Publisher:
W. H. Freeman