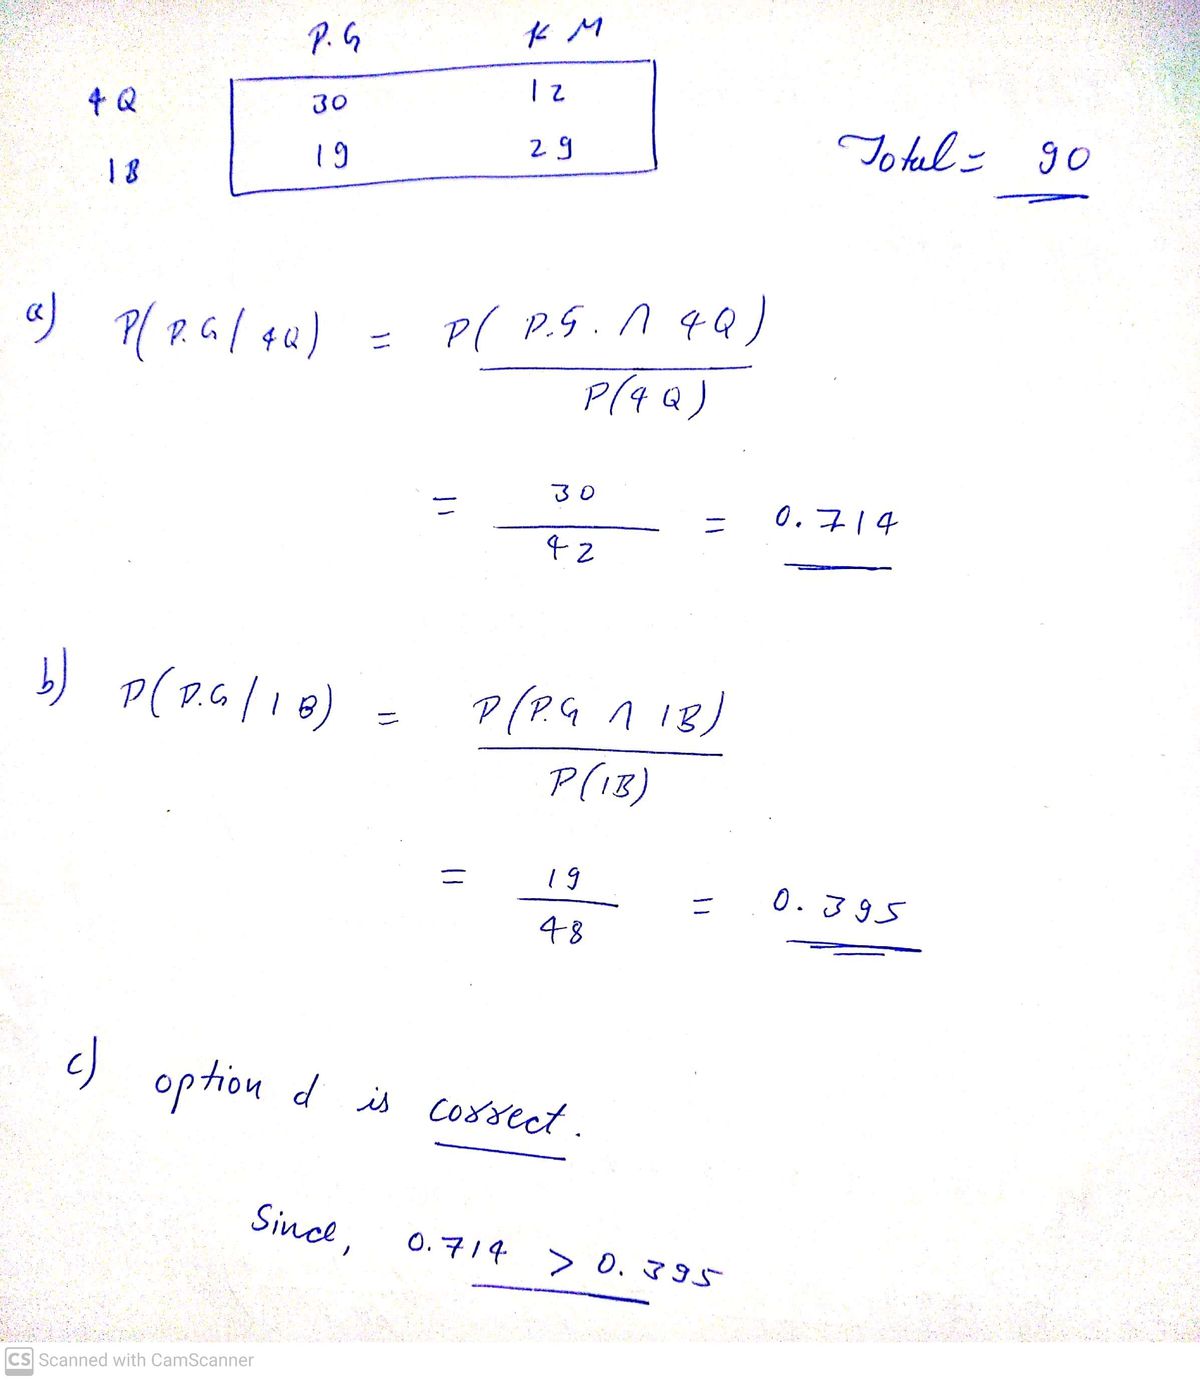
review statistics
Q: Plzzz explain. Ty
A: The sample observations of sample A are: 55.5,67.6,53.3,44.8,32.3,47.3,52.8,22.8,32.2,69.9. The…
Q: Define statistical survey. Discuss following methods of data collection with help of example: 1.…
A: Statistical survey is a scientific process used in research to collect quantitative and qualitative…
Q: hello, please compare the histograms well. state their differences and similarities
A: Introduction: A Histogram is a graphical representation used to summarise discrete or continuous…
Q: The two types of statistics, and give a reason why we use inferential statistics instead of…
A: Introduction: Descriptive and inferential statistics are the two types of statistics used in…
Q: Below are exam scores from a statistics class with 25 students: 100, 88, 90, 72, 76, 64, 68, 60, 78,…
A: From the provided information, Sample size (n) = 25 The number of students who scored above a 60 is…
Q: An average is an attempt to summarize a collection of data into just one number. Discuss how the…
A: A measure of…
Q: Please answer #13-17, Show all your work please thank you! In the first picture(first picture is…
A: Given Information: The graphical summary of the Age variable for the three treatment groups is…
Q: It is a type of data consists of names or labels that are not numbers representing counts or…
A: It is a type of data consists of names or labels that are not numbers representing counts or…
Q: Identify and discuss five limitations of statistics
A: The objective of this question is to identify and discuss five limitations of statistics. Statistics…
Q: The length of time it takes for a worker to perform certain task (in minutes) was recorded for 10…
A: Hi thank you for posting this question, since you have posted multiple subparts as per our policy…
Q: need answer for the test statistics section. Please check the image for the data. Last question in…
A: First we will calculate mean for both data set : N= 30 for both Profit from sales(X1) Mx1 =…
Q: Explain the following statistical terms 1.secondary 2.data point 3.metric variable 4.Array
A: Since you have posted a question with multiple sub-parts, we will solve first three subparts for…
Q: I. Find the weighted mean price of three models of television sets sold. The number and price of…
A: Given: Model Number PriceA 8 10,000…
Q: What is the mode of the data shown below?
A: Given : We have given data of stem and leaf stem Leaf 1 1,2 2 2,3,8 3 3,4,5 4 0,0,1…
Q: The following questions should be answered in the context of a large survey with which you are…
A: FOR ANY QUERIES PING ME
Q: Which are the two branches of statistics? Hint: Two correct answers. 1. interesting…
A: Ans: Which are the two branches of statistics?
Q: What is a scatter diagram, and for what kind of data is it a useful descriptive device?
A: It is needed to explain about the scatter diagram.
Q: Trees 1 2 3 4 5 6 Frequency 2 5 6 4 1 8
A:
Q: The graphs and charts below represent a survey using qualitative data. In the space provided below…
A: Note: Hi there! Thank you for posting the question. As your question has more than 3 parts, we have…
Q: List and describe two of the common types of explanation for statistical relationship (other than…
A:
Q: Write down the characteristics of statistics?
A:
Q: 6) Profession Engineer Artist Manager Facebook 20 15 10 Twitter 10 20 LO 5 Instagram 10 30 5…
A: The question is about categorical data analysis.Given :To find :Is there evidence to suggest that…
Q: What sorts of follow up questions about the statistics might you ask that person in order to obtain…
A: Statistics is a combination of applied mathematics which deals with data collection, organization…
Q: If you have data on your entire population, do you still need inferential statistics? why or why…
A: Inferential Statistics (IS) allows to make predictions.
Q: c. For which group is a birth weight of 2500 grams more common? Explain what that implies. Unusual…
A: The given z-scores are z=-2.03,z=-0.27.
Q: What is a easy way to learn the definitions in statistics. For example statistics sample…
A: It will be easy to learn the definitions in the following way: Population: Population consists of…
Q: Write one Quantitative Paragraph five sentences about Statistics!
A: Statistics is nothing but applied mathematics that deals with measurements of various type of data.…
Q: What is the interquartile range (QR) for the data set? 12, 14, 15, 18, 22, 24, 28, 31, 35 0 00 14.5…
A: Given data is Arrange the data in ascending order we get
Q: create a lesson plan oh how are you going to recall your students about the lesson you taught to…
A: Descriptive statistics : It contains summarization a collection of data in efficient and…
Q: Determine the five number summary and box plot for the following data (complete by hand on your…
A: Given: n = 13 Formula Used: The five numbers summary are: 1. Minimum value 2. First quartile Q1 =…
Q: Studies are often done by pharmaceutical companies to determine the effectiveness of a treatment…
A: Given that, Researcher A: 3; 4; 11; 15; 16; 17; 22; 44; 37; 16; 14; 24; 25; 15; 26; 27; 33; 29; 35;…
Q: In your own words, describe why we study statistics.
A: First of all, we know that Statistics is nothing but the analysis of data. If deals about the fact…
Q: You may need to use the appropriate appendix table or technology to answer this question. The…
A: Given data: Confidence level = 95% To calculate: Sample mean Sample standard deviation 95%…
Q: List and explain the steps included in the research process.
A: The research process is an organized approach to gathering and analyzing information about a…
Q: what were your thoughts on the role of statistics in engineering? 3-5 sentences please
A: Basically, Engineers work is to construct the designs , to find approximate values and to do…
Q: State at least 5 questions assessing demographic variables and state what kind of descriptive…
A: Demographic variable provide valuable information about the subject in the statistical analysis.
Q: Here is a tabular presentation of the data labels from the bar chart comparing mode of news across…
A: Introduction: It is required to identify what is wrong with the given data in the table.
Q: Make your own problem about single sample estimating mean. Include all of your solution.
A: Taking data Sr. No. Data (x) 1 2 2 5 3 6 4 4 5 8
Q: Hi! I need help solving the attached question. This is my first time using Bartleby so please let me…
A: The test for equality of more than two variances is done with MINITAB software.The results are given…
Q: Based on the tables can you write an in-depth summary for each? Thank you. Descriptive statistics…
A: The study investigates lifetime and recent drug use patterns among 261 heterosexually identified…
Q: 1. Describe the importance of statistics by discussing the use and applications of statistics in…
A: The statistics is the branch of mathematical sciences which deals with the collection,…
Q: question 5 18, 18, 19, 21, 23, 24, 24, 25, 26, 26 27, 27, 28, 30, 32, 34, 35, 35, 38, 41…
A: Answer - Find the mean, median and mode from the data 18, 18, 19, 21, 23, 24, 24, 25,…
Q: The National Sleep Foundation recommends that adults aged 18 to 64 get an average of 8 hours of…
A:
Q: Answer each question fully. Use a minimum of 250 words for a complete discussion post. While it is…
A: 1) An average is defined as a value that measures the central tendency of a given data set. It is a…
Need help with a review statistics question ASAP
Step by step
Solved in 2 steps with 1 images
- Two sections of statistics are offered, the first at 8 a.m. and the second at 10 a.m. The 8 a.m. section has 25 women, and the 10 a.m. section has 15 women. A student claims this is evidence that women prefer earlier statistics classes than men do. What information is missing that might contradict this claim? Question content area bottom Part 1 Choose the best answer below. A. The professor may be female in one class and male in the other, which could affect the female students' class preference. B. The percentage of female students in the two classes is unknown. There may be more females in the 8 a.m. because there are more students in the 8 a.m. class than the 10 a.m. class. This claim could be true only if the classes were the same size. C. The age and class standing of the students is unknown. Older female students may prefer later classes, so it may be only younger female students who prefer earlier classes. D. No information is…What is the easiest way to learn to remember the definitions Statistics Sample population Data perimeterDiscuss the way someone can perceive and consume statistical information experienced in everyday life. Has the way you perceive reported data or statistics changed in any way? If so, how? Cite a specific example that demonstrates how your thinking or reactions might have changed.
- Only answer part C, use Part B and the chart if needed.Question content area top A defunct website listed the "average" annual income for Florida as $35,031. What is the role of the term average in statistics? Should another term be used in place of average?This is a follow up question please answer both
- Write a detailed note on following: 1. What are the application of statistics in computing sciences? 2. How statistics is helpful in software engineering and information technology field and also write its importance?For one categorical Variable, what are the appropriate? Summary Statistics Visualizationswhen combined with high-quality research designs, statistics provide us with a greater sense of _____ in research personality subjectivity importance objectivity