Research suggests a link between mothers alcohol consumption with the birth weight of newborns. Random sampke of 100 mothers who drank during pregnancy, average birth weight od their babies is 7.2 lbs. Average birth weight nationwide is 7.8 lbs. And standard deviation is 1.56. Do mothers who drink have babiea that are significantly smaller compared to nationwide? Use alpha = 01. A. State the null abd the research hypothesisB. Identify the critical values of z or t used to define the decision ruleC. Calculate the test statisticD. Report the p-valueE. Report your findings


Research suggests a link between mothers alcohol consumption with the birth weight of newborns. Random sampke of 100 mothers who drank during pregnancy, average birth weight od their babies is 7.2 lbs. Average birth weight nationwide is 7.8 lbs. And standard deviation is 1.56. Do mothers who drink have babiea that are significantly smaller compared to nationwide? Use alpha = 01.
A. State the null abd the research hypothesisB. Identify the critical values of z or t used to define the decision ruleC. Calculate the test statisticD. Report the p-valueE. Report your findings
The given information is that the random sample of 100 mothers who drank during pregnancy has an average birth weight of their babies is 7.2 lbs.
Average birth weight nationwide is 7.8 lbs and standard deviation is 1.56 lbs.
A.
Hypotheses:
Null hypothesis:
H0: µ = 7.8 lbs.
That is, the mothers who drink during pregnancy have babies average birth weight is same as nationwide average birth weight.
Alternative hypothesis:
Ha: µ < 7.8 lbs.
That is, the mothers who drink during pregnancy have babies average birth weight is smaller than the nationwide average birth weight.
B.
Here, the population standard deviation is known. Then z-test can be used.
Critical value:
Calculate the z-critical value using Excel is as follows:
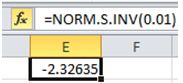
Therefore, the z-critical value is –2.326.
Decision rule:
If test statistic < critical value (–2.326), then reject the null hypothesis.

Step by step
Solved in 6 steps with 3 images


