Research determine that 70 Puffs tissues is the average nimber of tissues used during a cold. Suppose a random sample of 100 Puffs user yielded the following data on the number of tissues used during a cold: x-bar =60 and s = 25. Using the sample information provided, the value of the test statistic is?
Research determine that 70 Puffs tissues is the average nimber of tissues used during a cold. Suppose a random sample of 100 Puffs user yielded the following data on the number of tissues used during a cold: x-bar =60 and s = 25. Using the sample information provided, the value of the test statistic is?

A First Course in Probability (10th Edition)
10th Edition
ISBN:9780134753119
Author:Sheldon Ross
Publisher:Sheldon Ross
Chapter1: Combinatorial Analysis
Section: Chapter Questions
Problem 1.1P: a. How many different 7-place license plates are possible if the first 2 places are for letters and...

Related questions
Topic Video
Question
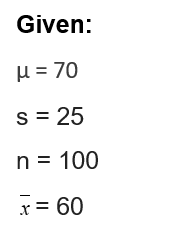
Research determine that 70 Puffs tissues is the average nimber of tissues used during a cold. Suppose a random sample of 100 Puffs user yielded the following data on the number of tissues used during a cold: x-bar =60 and s = 25. Using the sample information provided, the value of the test statistic is?
Expert Solution
Step 1

Step by step
Solved in 2 steps with 2 images

Knowledge Booster


Learn more about
Need a deep-dive on the concept behind this application? Look no further. Learn more about this topic, probability and related others by exploring similar questions and additional content below.Recommended textbooks for you
A First Course in Probability (10th Edition)
Probability
ISBN:
9780134753119
Author:
Sheldon Ross
Publisher:
PEARSON

A First Course in Probability (10th Edition)
Probability
ISBN:
9780134753119
Author:
Sheldon Ross
Publisher:
PEARSON