Required information [The following information applies to the questions displayed below.] The following capital expenditure projects have been proposed for management's consideration at Scott Inc. for the upcoming budget year: Use Table 6-4 and Table 6-5. (Use appropriate factor(s) from the tables provided. Round the PV factors to 4 decimals.) Project Year(s) B D $ (50,000) 5,000 10,000 15,000 20,000 $ (25,000) $ (50,000) $(100,000) $(25,000) 5,000 5,000 5,000 5,000 5,000 5,000 $ 1,081 Initial investment Amount of net cash return 16,000 16,000 1 10,000 10,000 10,000 6,000 24 30,000 30,000 15,000 15,000 15,000 15,000 2,942 3 16,000 16,000 16,000 4 5 25,000 Per year 6-10 NPV (14% discount rate) 24 $ Present value ratio 1.04 Required: . Calculate the net present value of projects B, C, and D, using 14% as the cost of capital for Scott Inc. (Negative amounts should be ndicated by a minus sign.)
Required information [The following information applies to the questions displayed below.] The following capital expenditure projects have been proposed for management's consideration at Scott Inc. for the upcoming budget year: Use Table 6-4 and Table 6-5. (Use appropriate factor(s) from the tables provided. Round the PV factors to 4 decimals.) Project Year(s) B D $ (50,000) 5,000 10,000 15,000 20,000 $ (25,000) $ (50,000) $(100,000) $(25,000) 5,000 5,000 5,000 5,000 5,000 5,000 $ 1,081 Initial investment Amount of net cash return 16,000 16,000 1 10,000 10,000 10,000 6,000 24 30,000 30,000 15,000 15,000 15,000 15,000 2,942 3 16,000 16,000 16,000 4 5 25,000 Per year 6-10 NPV (14% discount rate) 24 $ Present value ratio 1.04 Required: . Calculate the net present value of projects B, C, and D, using 14% as the cost of capital for Scott Inc. (Negative amounts should be ndicated by a minus sign.)

Chapter1: Financial Statements And Business Decisions
Section: Chapter Questions
Problem 1Q

Related questions
Question
I tried to find a way to get both tables needed for answering the problems.
![**Required Information**
*[The following information applies to the questions displayed below.]*
The following capital expenditure projects have been proposed for management's consideration at Scott Inc. for the upcoming budget year. Use Table 6-4 and Table 6-5. (*Use appropriate factor(s) from the tables provided. Round the PV factors to 4 decimals.*)
**Table: Project Cash Flows and Investment**
| Year(s) | Project A | Project B | Project C | Project D | Project E |
|----------|-------------|-------------|-------------|-------------|-------------|
| Initial investment | $(25,000) | $(25,000) | $(50,000) | $(50,000) | $(100,000) |
| Amount of net cash return | | | | | |
| 1 | 5,000 | 0 | 16,000 | 5,000 | 30,000 |
| 2 | 5,000 | 0 | 16,000 | 10,000 | 30,000 |
| 3 | 5,000 | 10,000 | 16,000 | 15,000 | 15,000 |
| 4 | 5,000 | 10,000 | 16,000 | 25,000 | 15,000 |
| Per year 6-10 | 5,000 | 6,000 | 0 | 0 | 15,000 |
| NPV (14% discount rate) | $1,081 | ? | ? | ? | $2,942 |
| Present value ratio | 1.04 | ? | ? | ? | |
**Required:**
a. Calculate the net present value of projects B, C, and D, using 14% as the cost of capital for Scott Inc. (*Negative amounts should be indicated by a minus sign.*)
| Project | Net Present Value |
|---------|-------------------|
| B | |
| C | |
| D | |](/v2/_next/image?url=https%3A%2F%2Fcontent.bartleby.com%2Fqna-images%2Fquestion%2F354988b1-49b5-4361-999f-1aaef20d6b01%2F6477abbe-064d-4426-9dce-210b2d6b1654%2Fl3mbsb_processed.jpeg&w=3840&q=75)
Transcribed Image Text:**Required Information**
*[The following information applies to the questions displayed below.]*
The following capital expenditure projects have been proposed for management's consideration at Scott Inc. for the upcoming budget year. Use Table 6-4 and Table 6-5. (*Use appropriate factor(s) from the tables provided. Round the PV factors to 4 decimals.*)
**Table: Project Cash Flows and Investment**
| Year(s) | Project A | Project B | Project C | Project D | Project E |
|----------|-------------|-------------|-------------|-------------|-------------|
| Initial investment | $(25,000) | $(25,000) | $(50,000) | $(50,000) | $(100,000) |
| Amount of net cash return | | | | | |
| 1 | 5,000 | 0 | 16,000 | 5,000 | 30,000 |
| 2 | 5,000 | 0 | 16,000 | 10,000 | 30,000 |
| 3 | 5,000 | 10,000 | 16,000 | 15,000 | 15,000 |
| 4 | 5,000 | 10,000 | 16,000 | 25,000 | 15,000 |
| Per year 6-10 | 5,000 | 6,000 | 0 | 0 | 15,000 |
| NPV (14% discount rate) | $1,081 | ? | ? | ? | $2,942 |
| Present value ratio | 1.04 | ? | ? | ? | |
**Required:**
a. Calculate the net present value of projects B, C, and D, using 14% as the cost of capital for Scott Inc. (*Negative amounts should be indicated by a minus sign.*)
| Project | Net Present Value |
|---------|-------------------|
| B | |
| C | |
| D | |

Transcribed Image Text:**Present Value and Annuity Factors Tables for Educational Purposes**
### Table 6.4: Factors for Calculating the Present Value of $1
This table shows the present value factors for $1 at various discount rates over different periods.
- **Columns**: The table is organized into columns that represent different discount rates ranging from 2% to 20%.
- **Rows**: The rows signify the number of periods, from 1 to 50.
- **Values**: Each cell within the table provides a factor that can be multiplied by the future value to determine its present value at the respective discount rate and period.
### Table 6.5: Factors for Calculating the Present Value of an Annuity of $1
This table presents the present value annuity factors for $1 received at the end of each period over several periods at various discount rates.
- **Columns**: Similar to Table 6.4, these columns represent different discount rates ranging from 2% to 20%.
- **Rows**: The rows also represent the number of periods, again from 1 to 50.
- **Values**: Each cell gives a factor used to calculate the present value of an annuity of $1. This is used in scenarios where equal cash flows occur at regular intervals, such as loan repayments or lease agreements.
These tables are essential tools in financial analysis, helping students and professionals alike calculate the worth of future cash flows in today's dollars. Understanding how to apply these tables is crucial for decision making in finance, investments, and real estate.
Expert Solution
Step 1
Present value method is used to evaluate the different level of investment projects. With the help of the present value method, we can find out the future value of present cash outflow. It is the most popular method to evaluate any investment plan.
Step 2
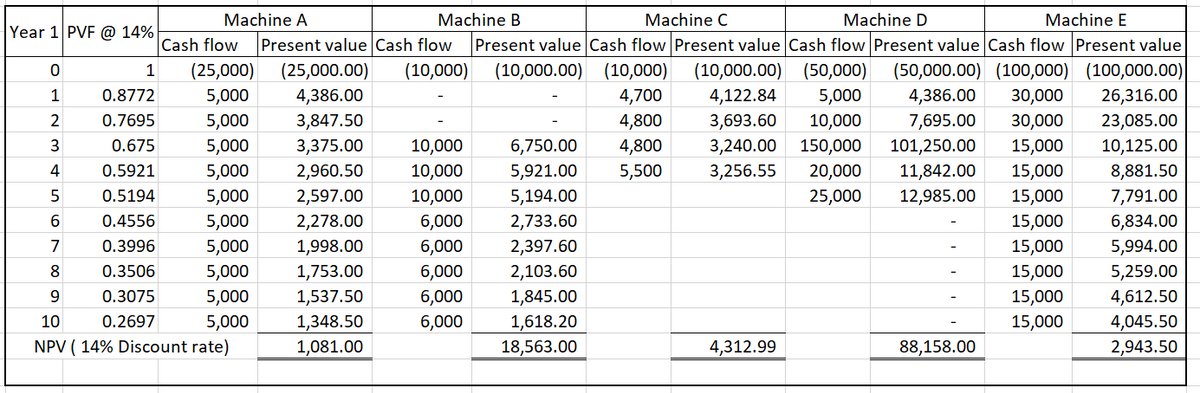
NPV
B = 18,563
C = 4,312.99 or 4,313
D = 88,158

Step by step
Solved in 3 steps with 2 images

Knowledge Booster


Learn more about
Need a deep-dive on the concept behind this application? Look no further. Learn more about this topic, accounting and related others by exploring similar questions and additional content below.Recommended textbooks for you

Accounting
Accounting
ISBN:
9781337272094
Author:
WARREN, Carl S., Reeve, James M., Duchac, Jonathan E.
Publisher:
Cengage Learning,

Accounting Information Systems
Accounting
ISBN:
9781337619202
Author:
Hall, James A.
Publisher:
Cengage Learning,
Accounting
Accounting
ISBN:
9781337272094
Author:
WARREN, Carl S., Reeve, James M., Duchac, Jonathan E.
Publisher:
Cengage Learning,
Accounting Information Systems
Accounting
ISBN:
9781337619202
Author:
Hall, James A.
Publisher:
Cengage Learning,

Horngren's Cost Accounting: A Managerial Emphasis…
Accounting
ISBN:
9780134475585
Author:
Srikant M. Datar, Madhav V. Rajan
Publisher:
PEARSON

Intermediate Accounting
Accounting
ISBN:
9781259722660
Author:
J. David Spiceland, Mark W. Nelson, Wayne M Thomas
Publisher:
McGraw-Hill Education

Financial and Managerial Accounting
Accounting
ISBN:
9781259726705
Author:
John J Wild, Ken W. Shaw, Barbara Chiappetta Fundamental Accounting Principles
Publisher:
McGraw-Hill Education