represen eeks since FakeblOCK went public, where 0

Advanced Engineering Mathematics
10th Edition
ISBN:9780470458365
Author:Erwin Kreyszig
Publisher:Erwin Kreyszig
Chapter2: Second-order Linear Odes
Section: Chapter Questions
Problem 1RQ
icon
Related questions
icon
Concept explainers
Question
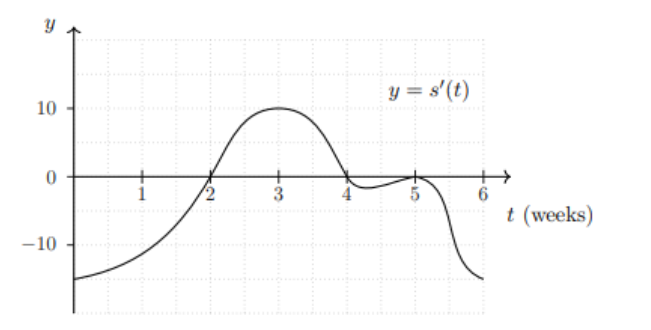
Let s(t) represent the value of Fakeblock stock in CAD at time t in weeks since Fakeblock
went public, where 0 <t< 6. The graph of the derivative y = s'(t) is below.
y = s'(t)
10
t (weeks)
-10
(a) What should the units on the y-axis be?
(b) List the appropriate values of t
i. The critical points of the stock value function s(t) are at t =
ii. The local minima of the stock value function s(t) are at t =
iii. The local maxima of the stock value function s(t) are at t =
iv. The inflection point(s) on the graph of s(t) are at t =
(c) Knowing the graph of s' above, when are the best times for an investor to buy and sell Fakeblock
stock?
I recommend buying the stock at
weeks after Fakeblock went public
and selling the stock at
weeks after Fakeblock went public.
Transcribed Image Text:Let s(t) represent the value of Fakeblock stock in CAD at time t in weeks since Fakeblock went public, where 0 <t< 6. The graph of the derivative y = s'(t) is below. y = s'(t) 10 t (weeks) -10 (a) What should the units on the y-axis be? (b) List the appropriate values of t i. The critical points of the stock value function s(t) are at t = ii. The local minima of the stock value function s(t) are at t = iii. The local maxima of the stock value function s(t) are at t = iv. The inflection point(s) on the graph of s(t) are at t = (c) Knowing the graph of s' above, when are the best times for an investor to buy and sell Fakeblock stock? I recommend buying the stock at weeks after Fakeblock went public and selling the stock at weeks after Fakeblock went public.
Expert Solution
Step 1

Note:

There are many subparts in the question. So I will answer the first two of them.

Please other questions send separately.

Given:

s(t) represents the value of Fakeblock in CAD at time t in weeks.

The graph of the y=s'(t) is:

Advanced Math homework question answer, step 1, image 1

Step 2

(a) The unit on the y-axis is:

We have y=s'(t) which give the rate of change of the value of Fakeblock in CAD per week

Hence, the unit for the y-axis is the value of Fakeblock in CAD/week.

(b) Let the appropriate values of t:

(i) The critical points of the stock value function s(t) are at t:

The critical points of s(t) define as the points at which y=s'(t)=0

which gives the given graph.

t=2, t=4, and t=5

Hence, the critical points of the stock value function s(t) are at t:

t=2, t=4, and t=5

steps

Step by step

Solved in 4 steps with 1 images

Blurred answer
Knowledge Booster
Fundamentals of Algebraic Equations
Learn more about
Need a deep-dive on the concept behind this application? Look no further. Learn more about this topic, advanced-math and related others by exploring similar questions and additional content below.
Similar questions
Recommended textbooks for you
Advanced Engineering Mathematics
Advanced Math
ISBN:
9780470458365
Author:
Erwin Kreyszig
Publisher:
Wiley, John & Sons, Incorporated
Numerical Methods for Engineers
Advanced Math
ISBN:
9780073397924
Author:
Steven C. Chapra Dr., Raymond P. Canale
Publisher:
McGraw-Hill Education
Introductory Mathematics for Engineering Applicat…
Advanced Math
ISBN:
9781118141809
Author:
Nathan Klingbeil
Publisher:
WILEY
Mathematics For Machine Technology
Advanced Math
ISBN:
9781337798310
Author:
Peterson, John.
Publisher:
Cengage Learning,
Basic Technical Mathematics
Advanced Math
ISBN:
9780134437705
Author:
Washington
Publisher:
PEARSON
Topology
Topology
Advanced Math
ISBN:
9780134689517
Author:
Munkres, James R.
Publisher:
Pearson,