Referring to the posted calibration curve ... A 154 g sample of a ruthenium ore was dissolved and diluted to 75.00 mL. 10.00 mL of this sample was removed, treated appropriately, and diluted to 250.00 mL. This solution has an absorbance of 0.840. Calculate the percentage of ruthenium (MW = 101.07 g/mol) in the sample.
Referring to the posted calibration curve ... A 154 g sample of a ruthenium ore was dissolved and diluted to 75.00 mL. 10.00 mL of this sample was removed, treated appropriately, and diluted to 250.00 mL. This solution has an absorbance of 0.840. Calculate the percentage of ruthenium (MW = 101.07 g/mol) in the sample.

Chemistry
10th Edition
ISBN:9781305957404
Author:Steven S. Zumdahl, Susan A. Zumdahl, Donald J. DeCoste
Publisher:Steven S. Zumdahl, Susan A. Zumdahl, Donald J. DeCoste
Chapter1: Chemical Foundations
Section: Chapter Questions
Problem 1RQ: Define and explain the differences between the following terms. a. law and theory b. theory and...

Related questions
Question
Referring to the posted calibration curve ...
A 154 g sample of a ruthenium ore was dissolved and diluted to 75.00 mL. 10.00 mL of this sample was removed, treated appropriately, and diluted to 250.00 mL. This solution has an absorbance of 0.840. Calculate the percentage of ruthenium (MW = 101.07 g/mol) in the sample.

Transcribed Image Text:S Shop Trendy Women's Fas X
N Calibration Curve to use o
b A 0.4567 g sample of a rut X M Inbox (486) - sydmccarthy x M Inbox (530) - symccart@n x +
->
i educat.nmu.edu/moodle2/pluginfile.php/613611/mod_resource/content/0/Calibration%20Curve%20to%20use%20on%20SEPT%2027.pdf
Update :
E Apps
O Current Student Inf...
N Technology Suppor.. N IT Services N My NMU
O NMU EduCat™M
N MyUser N NMU Library
M NMU Webmail
N Go to activity
E Reading list
>>
Calibration Curve to use on SEPT 27.pdf
1 / 1
60%
+
Calibration Curve to use for SEPT 27 and HW assignment..
1.2
1
0.8
1
A 0.6
0.4
0.2
0.005
0.01
0.015
0.02
0.025
0.03
0.035
(Ru), M
8:28 PM
O Type here to search
61°F Clear
9/28/2021
...
II
Expert Solution
Step 1
The calibration curve given is,
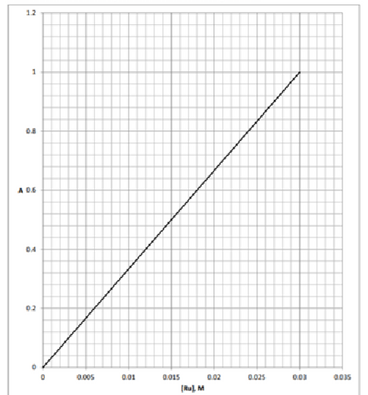
Given: Mass of sample used = 154 g.
Volume of original sample prepared = 75.00 mL = 0.07500 L (Since 1 L = 1000 mL)
Volume of original sample used = 10.00 mL = 0.010 L
Volume of final solution diluted to = 250.00 mL = 0.250 L
And absorbance of solution = 0.840

Step by step
Solved in 2 steps with 2 images

Recommended textbooks for you
Chemistry
Chemistry
ISBN:
9781305957404
Author:
Steven S. Zumdahl, Susan A. Zumdahl, Donald J. DeCoste
Publisher:
Cengage Learning

Chemistry
Chemistry
ISBN:
9781259911156
Author:
Raymond Chang Dr., Jason Overby Professor
Publisher:
McGraw-Hill Education

Principles of Instrumental Analysis
Chemistry
ISBN:
9781305577213
Author:
Douglas A. Skoog, F. James Holler, Stanley R. Crouch
Publisher:
Cengage Learning
Chemistry
Chemistry
ISBN:
9781305957404
Author:
Steven S. Zumdahl, Susan A. Zumdahl, Donald J. DeCoste
Publisher:
Cengage Learning
Chemistry
Chemistry
ISBN:
9781259911156
Author:
Raymond Chang Dr., Jason Overby Professor
Publisher:
McGraw-Hill Education
Principles of Instrumental Analysis
Chemistry
ISBN:
9781305577213
Author:
Douglas A. Skoog, F. James Holler, Stanley R. Crouch
Publisher:
Cengage Learning

Organic Chemistry
Chemistry
ISBN:
9780078021558
Author:
Janice Gorzynski Smith Dr.
Publisher:
McGraw-Hill Education

Chemistry: Principles and Reactions
Chemistry
ISBN:
9781305079373
Author:
William L. Masterton, Cecile N. Hurley
Publisher:
Cengage Learning

Elementary Principles of Chemical Processes, Bind…
Chemistry
ISBN:
9781118431221
Author:
Richard M. Felder, Ronald W. Rousseau, Lisa G. Bullard
Publisher:
WILEY