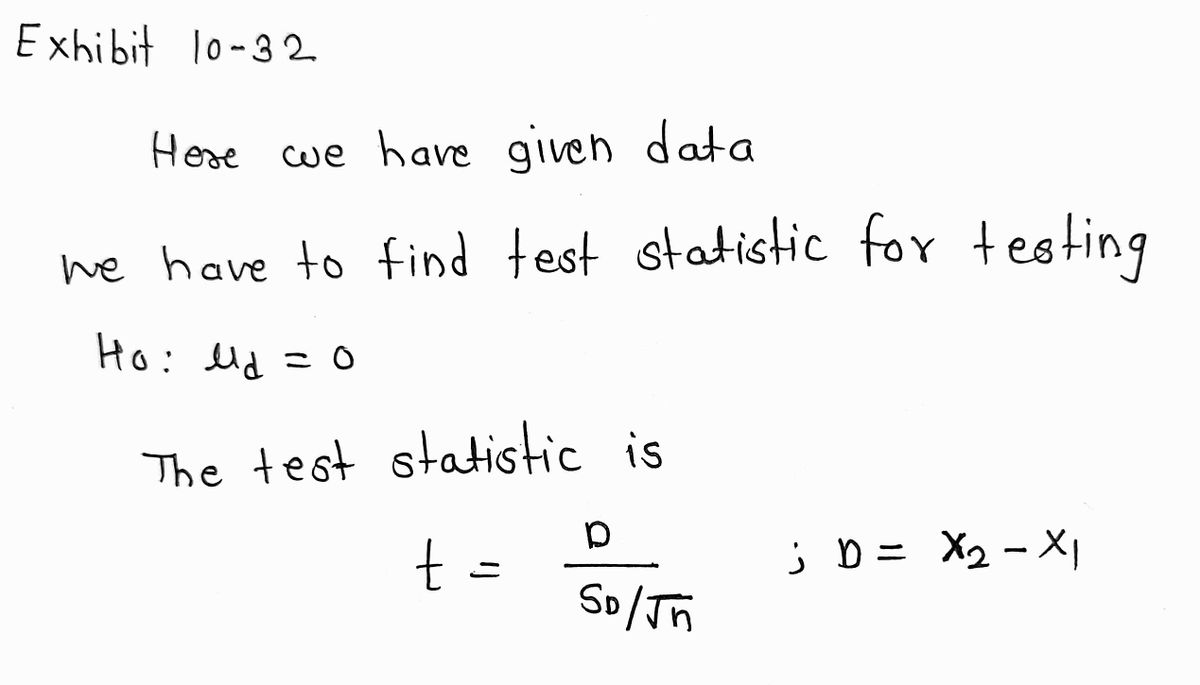
Refer to Exhibit 10-32. The null hypothesis tested is Ho: d= 0. The test statistic for the mean of the population of differences is
Q: When comparing two population proportions, what is the null hypothesis if the alternate hypothesis…
A: Solution: From the given information, the alternative hypothesis is p1>p2.
Q: In a two-tail test for the population proportion, if the null hypothesis is rejected when the…
A: In a two-tail test for the population proportion, if the null hypothesis is rejected when the…
Q: In a hypothesis test with a significance level of a = 0.01, we should reject the null hypothesis if…
A: The given is level of significance α=0.01 So, in hypothesis testing, we can reject the null…
Q: Tourism is extremely important to the economy of Florida. Hotel occupancy is an often-reported…
A: The question is about hypo. testing and confidence interval Given : Total no. of rooms in current…
Q: When comparing the difference between two population proportions, a pooled estimate of the…
A: Given that a pooled estimate of the population proportion can be used for two-tail tests
Q: a. H0: ______________ b. HA: ______________ c. Type of hypothesis test: __________________
A: Since you have posted a question with multiple sub-parts, we will solve first three subparts for…
Q: Find the standard error, t statics Sample variance = .67 Sample size = 30 Population size = 60…
A: Given information- Sample variance, s2 = .67 So, sample standard deviation, s = 0.819 Sample size, n…
Q: The critical boundaries for a hypothesis test are z = +1.96 and -1.96. If the z-score for the sample…
A: Solution: The critical boundaries for a hypothesis test are z = +1.96 and -1.96. Z test statistic or…
Q: . Write null and alternative hypotheses for p.
A: here given , Suppose the present success rate in the treatment of a particular psychiatric disorder…
Q: A credit score is used by credit agencies (such as mortgage companies and banks) to assess the…
A: From the provided information, Sample size (n) = 39 Sample mean (x̄) = 719.9 Sample standard…
Q: A hypothesis test is to be conducted using a .05 significance level. The null hypothesis is that the…
A:
Q: A z-test is to be performed for a population mean. Express the decision criterion for the hypothesis…
A: Given that z test is conducted to test population mean. The mean time is 11.8 seconds and SD is 0.42…
Q: A result is called "statistically significant" whenever Question 1Answer a. The p-value is…
A: The objective of the question is to identify the correct condition under which a result is…
Q: A sample of n = 16 individuals is selected from a population with = 60 and o = 6 and a treatment is…
A: Given that,Mean = 60Standard deviation = 6Sample size, n =16Sample mean, M = 63
Q: In testing for differences between the means of two related populations, what is the null…
A:
Q: State the null and alternative hypothesis (in symbol) for the given situtation. The variability of…
A:
Q: Which type of error can the statistician have made in the correct conclusion of this hypothesis…
A: Given that the decision about null hypothesis is Reject Ho The type I error is defined as rejecting…
Q: A value of r2=.09 is considered what for the effect size test of the percentage of variance…
A: Given, r2=0.09
Q: Which of the following tests will reject the null hypothesis that the two samples come from…
A: It is given that: For sample-1: x¯1=50, s1=10, n1=20. For sample-2: x¯2=60, s2=15, n2=25
Q: Tollowing statements are true matched pairs)? cerning the mean of the ences between two dependent…
A: The matched pairs dependent t-test is used when the same participants are tested more than once in…
Q: For which of the following is the mean greater than the median?
A: Among these graphs , no (e) is a negatively skewed distribution and according to the property of the…
Q: For a two-tailed hypothesis test evaluating the significance of a correlation, the null hypothesis…
A: Here we have given the question about the testing of significance of correlation coefficient. We…
Q: SS = 749.5 %3D SS = 830 %3D a. Use a one-tailed test with a = .05 to determine whether these data…
A: Given Data : we need to calculate standard deviations for both the samples , where the SS are given…
Q: In a test of hypothesis, the null hypothesis is that the population variance is equal to 4 and the…
A: The given information for the hypothesis test is as follows:Null Hypothesis H0: The population…
Q: The null hypothesis specifies a value of p for the population. What is the corresponding statistic…
A: The null hypothesis specifies a value of p for the population.
Q: The Pearson correlation is valuated for a sample of n=32 individuals.If a hypothesis test is used to…
A: we have to find out degree of freedom for t test statistics here given that the test the…
Q: A study considered whether daily consumption of garlic could reduce tick bites. The study used a…
A: Hypothesis is an assumption that is being tested.
Q: Students in Psyc 210 have found a relationship between practice quizzes and final grade; the more…
A: Given data, Students in Psyc 210 have found a relationship between practice quizzes and final grade;…
Q: If the proportion differs from 30%, then the lab will modify a proposed enlargement of its…
A:
Q: If a treatment is expected to decrease scores on a variable for which the mean is expecte
A: From the given information, If a treatment is expected to decrease scores on a variable. The mean is…
Q: A sample of scores has a mean of M = 20, a median of 28, and a mode of 29. What is the most likely…
A: Given Mean=20 Median=28 Mode=29
Q: Suppose that you want to perform a hypothesis test based on independent random samples to compare…
A:
Q: In a hypothesis test, the null hypothesis states that the population variance is equal to 25. A…
A: Given information Population variance =σ2=25, n=sample size=36, sample variance s2=30
Q: Express the null hypothesis and the alternative hypothesis in symbolic form. Use the correct symbol…
A:
Q: When we test the hypothesis that the population proportions are equal, we can use the Z test for a…
A: It is given that the statement about to the hypothesis test.
Q: Suppose that the sample average is 44.4 while the null hypothesis is that the population mean is 44.…
A: given data, sample average =44.4population mean is =44standard error=1test statistics=?
Step by step
Solved in 2 steps with 2 images
- A sociologist claims that the students’ college GPA’s in unrelated to their families’ incomes. For a random sample of 20 students the coefficient of correlation was computed as 0.40. Using the 0.01 significance level, do the formal hypothesis test.Remember to show your steps (including all relevant information) show the steps on how to solve itA polling company conducted a hypothesis test to see if people are happy with the government, and they did so by conducting a two-sided test for a population ratio. population proportion). They calculated the value of the test statistic and found that it wasz=2.1 .What is the p-value of the test?Suppose the present success rate in the treatment of a particular psychiatric disorder for the relevant population is known to be .73 (73%). A research group hopes to demonstrate that the success rate of a new treatment will be better than this standard. Use the letter p to represent the success rate of the new treatment. Write null and alternative hypotheses for p. Ho: p|? v H2: p? v a
- A Data analytics professor wants to know whether level of college education influences the grade earned by students in his course. Last semester, 400 students completed his class: 150 freshmen, 100 sophomores, 100 juniors, and 50 seniors. At end of the semester, 80 students earned an A, 148 earned a B, and 172 earned a C. The distribution of grades is shown in the following table. Do a chi-square test at alpha=0.05. What is the null hypothesis for this test? A. The letter grades of the students are significantly different. B. The letter grades of the students are dependent of the level of college education. C. The letter grades of the students are identical. D. The letter grades of the students are independent of the level of college education.- test the null hypothesis that the population mean, u is 14.A company is doing a hypothesis test on the variation in quality from two suppliers. Both distributions are normal, and the populations are independent. Use a = 0.05. A sample of 31 products were selected from Supplier 1 and a standard deviation of quality was found to be 3.77. A sample of 16 products were selected from Supplier 2 and a standard deviation of quality was found to be 3.5659. Test to see if the variance in quality for Supplier 1 is larger than Supplier 2. What are the correct hypotheses? Note this may view better in full screen mode. Select the correct symbols in the order they appear in the problem. Ho: 0.² H₁: 0.² Based on the hypotheses, compute the following: Round answers to at least 4 decimal places. The test statistic is = The p-value is = The decision is to [Fail to reject the null hypothesis The correct summary would be: There is not enough evidence to support the claim in quality for Supplier 1 is larger than Supplier 2. o that the variance
- A researcher was interested in knowing if mean BMI was different between males and females. He obtained the following test results. Choose the correct interpretation of the results: F test p value = 0.30 Two sample t test, assume equal variance = 0.02 Two sample t test, assume unequal variance = 0.61 Mean BMI is not significantly different between males and females. None Mean BMI is higher in males than females. Mean BMI is significantly different between males and females.Solve the problem. When performing a hypothesis test for the ratio of two population variances, the upper critical F value is denoted FR. The lower critical F value, FL, can be found as follows: interchange the degrees of freedom, and then take the reciprocal of the resulting F value found in table A-5. FR can be denoted Fa/2 and FL can be denoted F1-a/2 - Find the critical values FL and FR for a two-tailed hypothesis test based on the following values: n₁ = 4, n₂ = 8, a = 0.05 0.1703, 5.8898 0.1112, 5.0453 0.0684. 5.8898 O 0.1211, 4.3541An independent-measures research project has two sample variances, 12 and 6. Calculate the F-Max test for this project. Your answer will be a whole number
- A researcher predicts that smoking cigarettes decreases a person's sense of smell. On a test of olfactory sensitivity (smell), the mean for non-smokers is 18.4. A sample of 12 people who smoke a pack each day have a sample mean of 16.25 (sample variance = 4.75). Complete the following statement: We ["", ""] the null. Smokers have ["", "", ""] in olfactory sensitivity compared to non-smokers.The null hypothesis when testing for a single population can take many forms depending on the parameter being studied. If the parameter of interest is the population mean, which statement best represents the original claim that the parameter equals a given value, k?