QUESTION 4 According to the Risk Impact Matrix chart shown previously, which item (shown by letter) is thought to be the highest risk? OA. "A" OB "B"
QUESTION 4 According to the Risk Impact Matrix chart shown previously, which item (shown by letter) is thought to be the highest risk? OA. "A" OB "B"

MATLAB: An Introduction with Applications
6th Edition
ISBN:9781119256830
Author:Amos Gilat
Publisher:Amos Gilat
Chapter1: Starting With Matlab
Section: Chapter Questions
Problem 1P

Related questions
Question
Please answer 4&5

Transcribed Image Text:**Question Completion Status:**
---
**QUESTION 4**
According to the Risk Impact Matrix chart shown previously, which item (shown by letter) is thought to be the highest risk?
- O A. "A"
- O B. "B"
- O C. "C"
- ● D. "D"
- O E. "E"
- O F. "F"
- O G. "G"
---
**QUESTION 5**
If we lack enough resources to act on all, which risk might we decide first to accept "as is" without any action?
- O A. "A"
- O B. "B"
- O C. "C"
- O D. "D"
- O E. "E"
- O F. "F"
- O G. "G"
---
Click Save and Submit to save and submit. Click Save All Answers to save all answers.

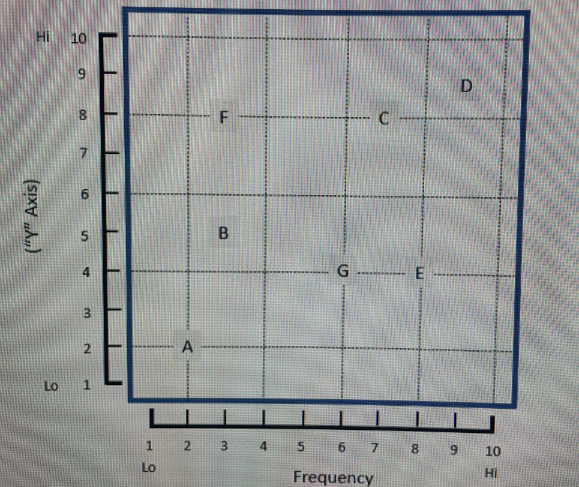
Transcribed Image Text:**Description of the Image:**
The text in the image states: "The following applies to this and the next several questions: Dan asks you to review his Risk G on the chart using a 1-10 scale."
**Explanation of the Graph:**
The graph is a 10x10 grid chart with the y-axis labeled as "Y Axis" and the x-axis labeled as "Frequency." Both axes are scaled from 1 (Lo) to 10 (Hi).
- **Y Axis (vertical):** Ranges from 1 (Lo) at the bottom to 10 (Hi) at the top.
- **X Axis (horizontal):** Labeled "Frequency" and ranges from 1 (Lo) on the left to 10 (Hi) on the right.
The graph includes several plotted points labeled from A to G:
- **Point A** is located at (2, 2).
- **Point B** is located at (3, 5).
- **Point C** is located at (7, 7).
- **Point D** is located at (8, 9).
- **Point E** is located at (7, 4).
- **Point F** is located at (4, 8).
- **Point G** is located at (5, 3).
Each point represents a different value on both the frequency and the y-axis scales. The purpose is likely risk assessment, with each point indicating a level of risk based on its position on the grid.
Expert Solution
Step 1
The risk impact matrix with 1-10 scale by considering in Horizontal axis and in vertical axis is displayed below.

Step by step
Solved in 2 steps with 1 images

Recommended textbooks for you
MATLAB: An Introduction with Applications
Statistics
ISBN:
9781119256830
Author:
Amos Gilat
Publisher:
John Wiley & Sons Inc

Probability and Statistics for Engineering and th…
Statistics
ISBN:
9781305251809
Author:
Jay L. Devore
Publisher:
Cengage Learning

Statistics for The Behavioral Sciences (MindTap C…
Statistics
ISBN:
9781305504912
Author:
Frederick J Gravetter, Larry B. Wallnau
Publisher:
Cengage Learning
MATLAB: An Introduction with Applications
Statistics
ISBN:
9781119256830
Author:
Amos Gilat
Publisher:
John Wiley & Sons Inc
Probability and Statistics for Engineering and th…
Statistics
ISBN:
9781305251809
Author:
Jay L. Devore
Publisher:
Cengage Learning
Statistics for The Behavioral Sciences (MindTap C…
Statistics
ISBN:
9781305504912
Author:
Frederick J Gravetter, Larry B. Wallnau
Publisher:
Cengage Learning

Elementary Statistics: Picturing the World (7th E…
Statistics
ISBN:
9780134683416
Author:
Ron Larson, Betsy Farber
Publisher:
PEARSON

The Basic Practice of Statistics
Statistics
ISBN:
9781319042578
Author:
David S. Moore, William I. Notz, Michael A. Fligner
Publisher:
W. H. Freeman

Introduction to the Practice of Statistics
Statistics
ISBN:
9781319013387
Author:
David S. Moore, George P. McCabe, Bruce A. Craig
Publisher:
W. H. Freeman