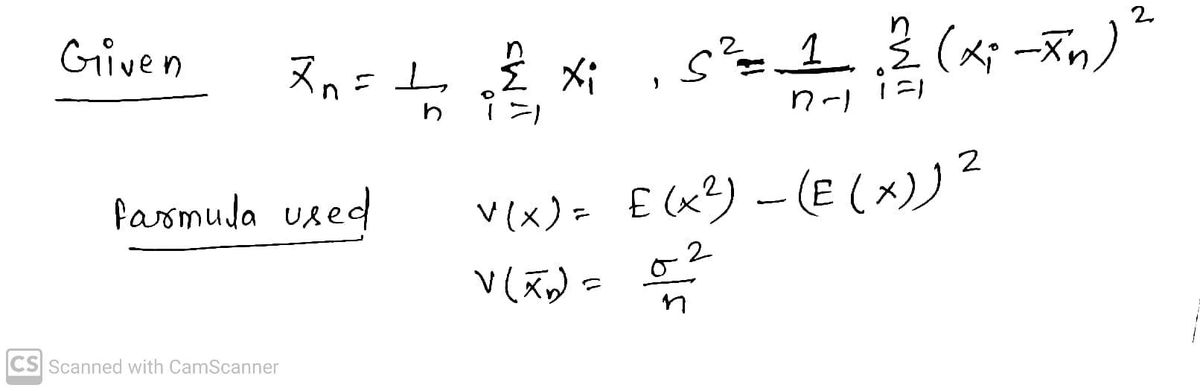
Question 0. Let X₁, , Xn be iid random variables with unknown mean u and unknown variance - 0². Let Xn=1 Xi and S² = 11 (Xi - Xn)² be the sample based estimators of u and o2, respectively. Show S2 is an unbiased estimator of o2 (see the lecture not
Q: Give two ways to compute the variance of a continuous random variable.
A: 1.Using expectation formula i.e. here E(X) of a continuous variable X can be calculated as…
Q: An experiment samples two independent populations X and Y. • X is sampled 26 times yielding sample…
A: Provided information is ; For sample 1: sample size(n1) =26 ,sample mean( x¯)=34.1 ,…
Q: The number of people in a car that crosses a certain bridge is a random variable x. The toll on the…
A: Let us denote: X= number of persons Y= amount of money collected The fixed charge is $2. And per…
Q: Show that adding a constant K to a random variable increases the average by K but does not change…
A: Suppose I have a below data For random variable X 2,5,8,4 consider k= 2 Average of 2,5,8,4 using…
Q: and second components meet specifications are 0.96 and 0.89, respectively. Let X be the number of…
A: The random variable X defines the number of components in the assembly that meet specification.
Q: Two independent random variables X and Y have 36 and 16.Find the correlation co-efficient between…
A:
Q: Let x1,...x40 be IID binomial random variable with parameters p = 0.3 find the mean and variance of…
A: Let x1,...x40 be IID binomial random variable with parameters p = 0.3 We need to find the mean and…
Q: One sample with n =8 has a S2 = 6 and a second sample n = 8 scores has a S2 = 10. If the pooled…
A:
Q: Suppose that the random variable X measures the number of hot dogs purchased in a food court in an…
A: CorX,Y=0.75VX=VY=36W=2X+3Y
Q: The sample correlation for 68 pairs of annual returns on common stocks in country A and country B…
A: The followings are specified: The no. of sampled paired observations, n=68. The sample correlation…
Q: Find the variance of the weight of all the beans in a box. Please provide where did you get the…
A: Farmula used V(nY)=n2V(Y)
Q: If the random variable x is distributed through the Binomial(n,0.5), if the mean of x =3,then the…
A: We have to find variance of x...
Q: Suppose that the time between failures, Ti, is approximately normally distributed with mean400 hours…
A: We can use the normal distribution to model the number of repair cycles in a one-year period. First,…
Q: sample of size 50 is taken from a continuous uniform random varlable with parameters 1 and 39. What…
A: We know that The pdf of Uniform distribution is f(x) = 1/(b-a) , a<x<b Variance of X =…
Q: QUESTION 9 An analysis of variance differs from a t test for independent means in that an analysis…
A: We want to tell you which one is the correct choice.
Q: One major assumption with independent t tests is called “homogeneity of variances.” Describe this…
A: Independent Two Samples t-test:Suppose there are two populations independent of one another. A…
Q: hich is unknown to us, so we use the sample variance to estimate the standard error for our…
A: As given, n1: The sample size of blood pressure of African zebras. = 5 n2: The sample size of blood…
Q: Suppose X is a binomial random variable with parameters n=18 and p=0.5 Calculate the mean and…
A: For the given question- Mean: 9 Variance: 4.5Explanation:Solution- To calculate the mean and…
Q: The farmers' association of the Amatole region in the Eastern Cape wants to report on the average…
A: Given that Y1, Y2, Y3, Y4 is a random sample of farms, which is normally distributed with mean μ and…
Q: A couple wishes to have children until they have exactly two female children in their family. p =…
A: Given problem Given that A couple wishes to have children until they have exactly two female…
Q: Suppose a batch of metal shafts produced in a manufacturing company have a variance of 6.25 and a…
A: Suppose the random variable x defines the diameter of metal shafts.
Q: ds the data for the Analysis of Variance (ANOVA). If she reported the test statisti .1 "hat is the…
A: Given For the given scenario of ANOVA We have Number of groups=k=5
Q: Describe research situation to illustrate the use of the One-way Analysis of Variance and one…
A: We know that, Assumptions of One-way analysis of variance (ANOVA) : 1] Samples are randomly…
Q: No programming please. I don’t want a code as an answer.
A: Approach to solving the question:1. Calculate the non-centrality parameter (λ) using the given…
Q: Suppose X is a binomial random variable with parameters n=10 and p=0.3 Calculate the mean and…
A: The mean of X is 3. The variance of X is 2.1. Explanation:Step 1: If X follows binomial…
Q: Consider two independent random variables X and Y with Means of 17 for the first variable is 1 and…
A: Let the new variable be Z = 3X - 4Y The mean is given by E(Z) =3E(X) - 4E(Y) E(Z) = 3(17) -…
Q: A production engineer wants to determine if two assembly lines are producing the same mean number of…
A:
Q: Two separate samples, each with n = 14 individuals, receive different treatments. After treatment,…
A: # Given : two samples n1=n2=14 and sample varience S1^2=1638 and S2^2=1620 then to find pooled…
Q: The number of people in a car that crosses a certain bridge is a random variable x. The toll on the…
A: Given The random variable X denotes the number of people in a car The toll charges: $ 5 per car…
Q: Let a random experiment be the casting of a pair of fair five-sided dice and let X equal the maximum…
A: Given, 2 fair dice are thrown simultaneously. Each die has 5 sides. X: The maximum of two outcomes.…
Q: Given a random variable X with mean ux and variance ož, find the mean and variance of the random…
A: Given, Mean Of Random Variable X : EX=μX Variance Of Random Variable X : VarX=σX2 New Random…
Q: X is a binomial random variable with n= 20 and p= 0.46 Find the mean and variance for X?
A: Answer: Using the given data, X follows binomial distribution with n = 20 and p = 0.46 X ~ Binomial…
Q: You know that the sample mean, X. is the minimum variance unbiased estimator of . with a variance of…
A:
Q: Suppose that X1, X2, X3 and X4 are all independent random variables, each with a normal…
A:
Q: Let X and Y be independent random variables. Suppose X has variance 2 and let Y have variance 5.…
A: Given Data: Var(X)=2 Var(Y)=5
Q: hich of the folllowing statements is necessarily true if yt follows an ARCH(1) process? a) the…
A:
Q: A nail is needed to hang up a 50 lb painting on a wall. A technician has two nails in his pocket,…
A: Suppose a random variable x defines the number of nails meet the specific weight of the painting.
Q: 21. An investor is considering two types of investment. She is quite satisfied that the expected…
A: Given information: n1=7, n2=10s12=225, s22=118
Q: Two separate samples, each with n = 14 individuals, receive different treatments. After treatment,…
A:
Q: C and D only
A: Solution:
Q: Rods are produced in large quantities in a factory. The masses of these rods are normally…
A: Since you have asked multiple question, we will solve first question for you. If you want any…
Step by step
Solved in 2 steps with 2 images
- We are running a hypothesis test to see if weight of African zebras is significantly different than that of Arabian horses. We assume weight in both populations is normally distributed and both populations have the same population variance in weight which is unknown to us, so we use the sample variances to estimate the standard error for our calculations. We have a sample of size 9 for the African zebras with mean 650 and a sample of size 16 for the Arabian horses with mean 660. If the pooled variance is 225, then what is the absolute value of the standardized test statistic for our data?The nation of Olecarl, located in the South Pacific, has asked you to analyze international trade patterns. You first discover that each year it exports 10 units and im- ports 10 units of wonderful stuff. The price of exports is a random variable with a mean of 100 and a vari- ance of 100. The price of imports is a random variable with a mean of 90 and a variance of 400. In addition, you discover that the prices of imports and exports have a correlation of r = -0.40. The prices of both ex- ports and imports follow a normal probability density function. Define the balance of trade as the difference between the total revenue from exports and the total cost of imports. What are the mean and variance of the balance of trade? What is the probability that the balance oft trade is negative?We are running a hypothesis test to see if blood pressure of African zebras differs significantly from Arabian horses. We assume blood pressure in both populations is normally distributed and both populations have the same population variance in blood pressure which is unknown to us, so we use the sample variances to estimate the standard error for our calculations. We have a sample of size 9 for the African zebras and a sample of size 16 for the Arabian horses. How many degrees of freedom does our test statistic have?
- 1. Exploring the role of level of confidence: b. Construct 1,000 confidence intervals with n = 100, p = 0.3. What proportion of the99% confidence intervals included the population proportion, 0.3? Reset and Construct another 1,000 confidence intervals with n = 100, p = 0.3. Whatproportion of the 99% confidence intervals included the population proportion, 0.3? Did the same proportion of intervals include the population proportion each time?What proportion did you expect to include the population proportion in each part?Suppose we flip three fair coins. Let X = number of Heads.(a) Calculate the variance of X directly by using ONLY the PMF for X and theformula for variance (b) Calculate the variance again, but this time, use some of the tools from thebottom of page 9 (split X into 3 Bernoulli r.v.s).(c) Let Y = three times the Bernoulli r.v. for the first coin. Calculate Var(Y ).(d) Explain why your answer to Part C is different from Parts A and B.How do I get the variance ?
- When a random variable X follows binomial distribution, the probability of success on one trian is equal to 0.6, and the number of trials is eual to 120, What is the variance of X ? |------8 If the analysis of variance F-test leads to the conclusion that at least one of the model parameters is nonzero, can you conclude that the model is the best predictor for the dependent variable y? Can you conclude that all of the terms in the model are important for predicting y? What is the appropriate conclusion?A researcher is interested whether a new drug is effective in changing patients' cholesterol levels. She divided 33 patients into 3 groups according to the dosage the patient received. The cholesterol levels of all patients are measured and used as the data for the Analysis of Variance (ANOVA). If she reported the test statistic F = 2.1 What is the degree of freedom for the numerator of the F statistic? What is the degree of freedom for the denominator of the F statistic? What is the P-value of the F-test? (Round to 3 decimals) Given the significance level of 0.01, what can she conclude from the test? *The patients in differnt groups have simliar average cholesterial levels. The drug made no difference. *At least one group of patients have an average cholesterol level that is different from the other groups. The drug may have an effect.
- We are running a hypothesis test to see if weight of African zebras is significantly different than that of Arabian horses. We assume weight in both populations is normally distributed and both populations have the same population variance in weight which is unknown to us, so we use the sample variances to estimate the standard error for our calculations. We have a sample of size 9 for the African zebras with mean 650 and a sample of size 16 for the Arabian horses with mean 659. If the pooled variance is 81, then what is the absolute value of the standardized test statistic for our data?Two separate samples, each with n = 14 individuals, receive different treatments. After treatment, the first sample has SS = 1512 and the second has SS = 1620. Find the pooled Variance for two independent samples. (hundredths place) Type only the pooled variance.The data shown in the table represent the measurements of 10-kΩ resistors (in kΩ) produced from five different machines. A random sample of nine resistors from each machine is taken to determine whether the mean resistance varies from one machine to another. Perform analysis of variance and test the hypothesis at the 0.05 level of significance that the mean resistances differ significantly for the five machines, all through manual computations. Show all complete and systematic solutions.