Q Se ction to Hypothesis Testing 13. Researchers at a National Weather Center in the northeastern United States recorded the number of 90° days each year since records first started in 1875. The numbers form a normal shaped distribution with a mean of u = 9.6 and a standard deviation of o = 1.9. To see if the data showed any evidence of global warming, they also computed the mean number of 90° days for the most recent n = 4 years and obtained M = 11.85. Do the data indicate that the past four years have had significantly more 90° days than would %3D be expected for a random sample from this population? Use a one-tailed test with a = .05. %3D Answer + 14. Montarello and Martens (2005) found that fifth-grade students completed more mathematics problems correctly when simple problems were mixed in with their regular math assignments. To further explore this phenomenon, suppose that a researcher selects a standardized mathematics achievement test that produces a normal distribution of scores with a mean of = 100 and a standard deviation of o = 18. The researcher modifies the test by inserting a set of very easy problems among the standardized questions, and gives the modified test to a sample of n = 36 students. If the average test score for the sample is M = 104, is this result sufficient to conclude that inserting the easy questions improves student %3D performance? Use a one-tailed test with a = .01. 15. Researchers have noted a decline in cognitive functioning as people age (Bartus, 1990). However, the results from other research suggest that the antioxidants in foods such as blueberries can reduce and even reverse these age-related declines, at least in laboratory rats (Joseph et al., 1999). Based on these results, one might theorize that the same antioxidants might also benefit elderly humans. Suppose a researcher is interested in testing this theory. The researcher obtains a sample of n = 16 adults who are older than 65, %3D articinont o deilku doge of a blusher Sunplenment that is very hiơh in antioxidants. After
Addition Rule of Probability
It simply refers to the likelihood of an event taking place whenever the occurrence of an event is uncertain. The probability of a single event can be calculated by dividing the number of successful trials of that event by the total number of trials.
Expected Value
When a large number of trials are performed for any random variable ‘X’, the predicted result is most likely the mean of all the outcomes for the random variable and it is known as expected value also known as expectation. The expected value, also known as the expectation, is denoted by: E(X).
Probability Distributions
Understanding probability is necessary to know the probability distributions. In statistics, probability is how the uncertainty of an event is measured. This event can be anything. The most common examples include tossing a coin, rolling a die, or choosing a card. Each of these events has multiple possibilities. Every such possibility is measured with the help of probability. To be more precise, the probability is used for calculating the occurrence of events that may or may not happen. Probability does not give sure results. Unless the probability of any event is 1, the different outcomes may or may not happen in real life, regardless of how less or how more their probability is.
Basic Probability
The simple definition of probability it is a chance of the occurrence of an event. It is defined in numerical form and the probability value is between 0 to 1. The probability value 0 indicates that there is no chance of that event occurring and the probability value 1 indicates that the event will occur. Sum of the probability value must be 1. The probability value is never a negative number. If it happens, then recheck the calculation.
Question 14

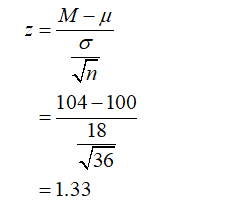
From the provided information,
Sample size (n) = 36
Population Mean (µ) = 100
Population standard deviation (σ) = 18
Sample mean (M) = 104
Level of significance (α) = 0.01
The hypotheses can be constructed as:
Null hypothesis H0: µ = 100
Alternative hypothesis H1: µ >100
The test is right tailed. The population standard deviation is given so the z distribution will be used.
The value of the test statistic can be obtained as:

Step by step
Solved in 3 steps with 1 images


